Open Access
Fig. 6
Download original image
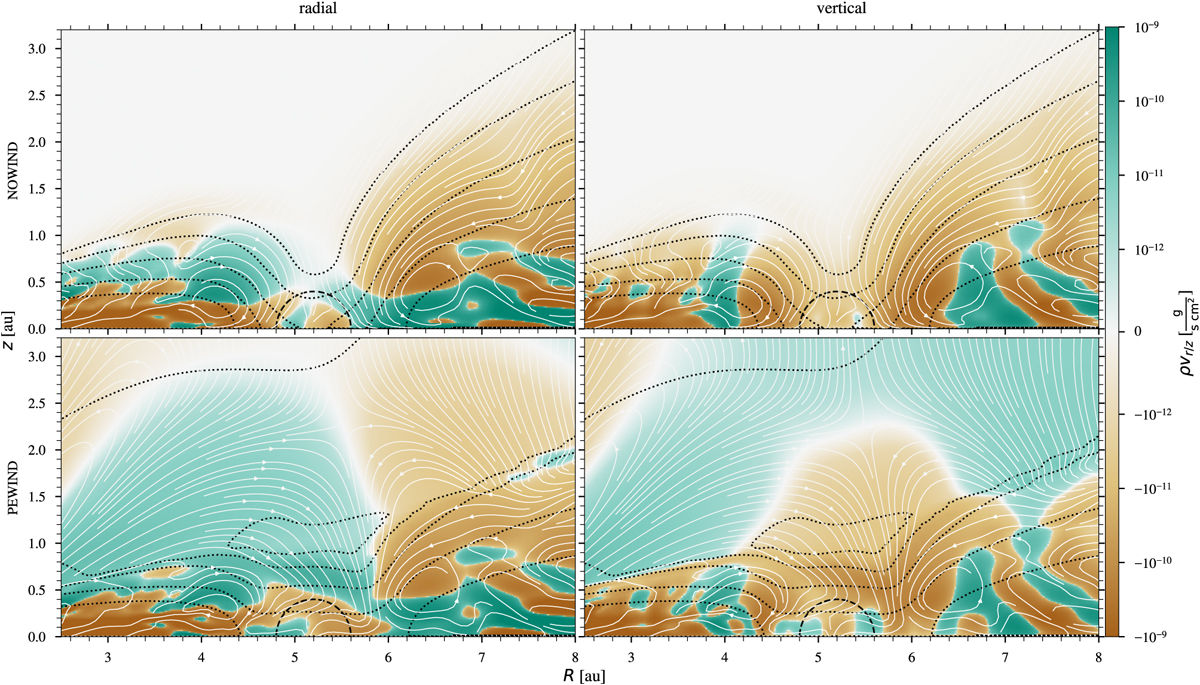
Azimuthally averaged radial and vertical mass flux. The dotted black lines are density contours for (from top to bottom) 10−17 to 10−13 g cm−3 in increments of one order of magnitude. The dashed black circles show the Hill sphere of the planet. The white solid lines are streamlines of the gas.
Current usage metrics show cumulative count of Article Views (full-text article views including HTML views, PDF and ePub downloads, according to the available data) and Abstracts Views on Vision4Press platform.
Data correspond to usage on the plateform after 2015. The current usage metrics is available 48-96 hours after online publication and is updated daily on week days.
Initial download of the metrics may take a while.