Fig. 5
Download original image
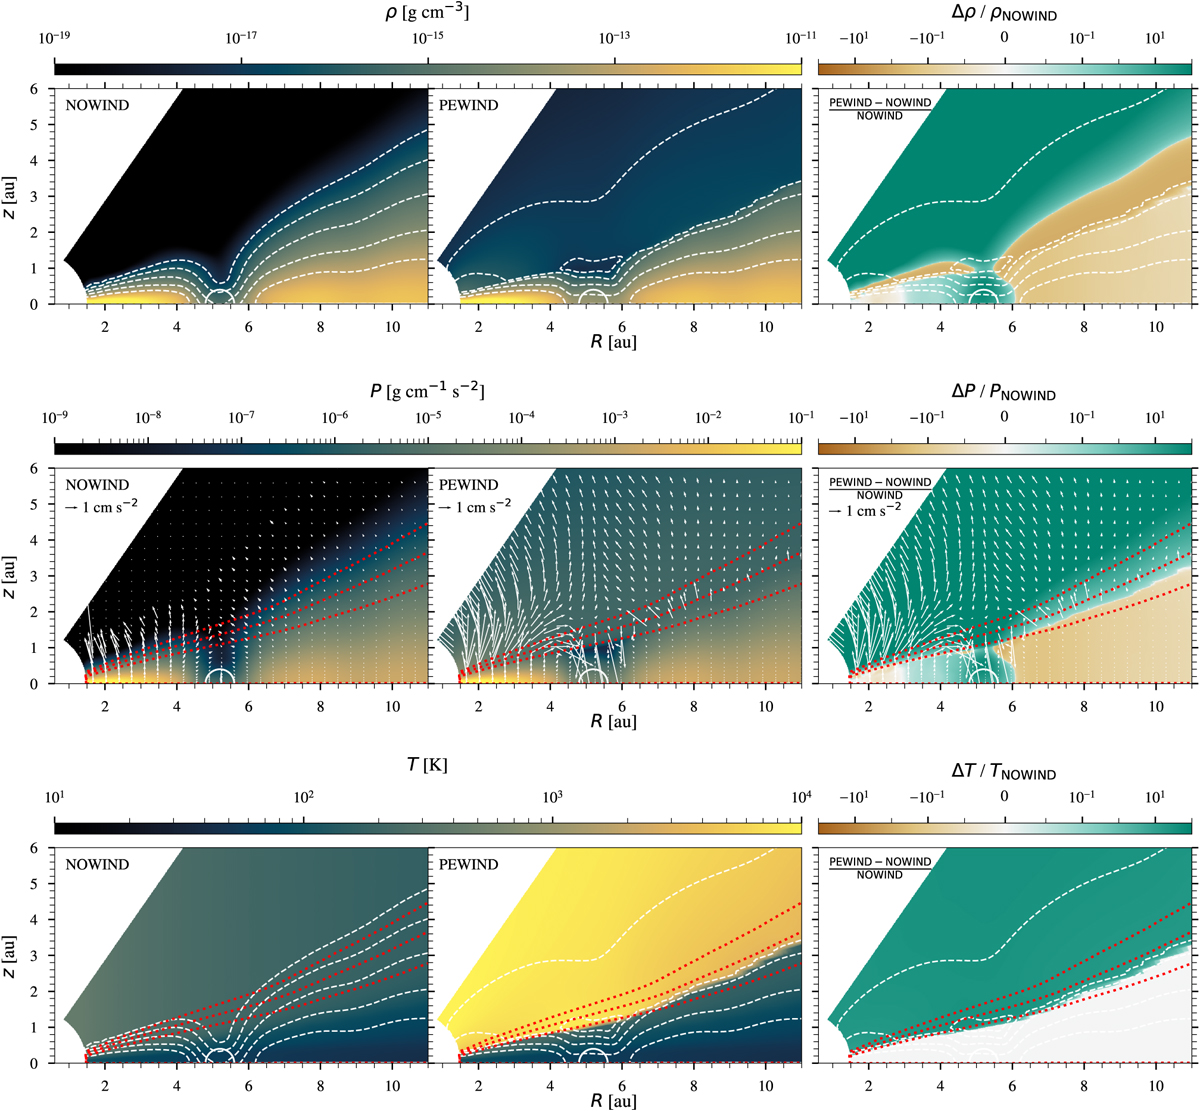
From top to bottom: azimuthally averaged gas density, gas pressure, and gas temperature. From left to right: NOWIND model, PEWIND model, and their relative difference. Dashed white lines are density contours for (from top to bottom) 10−17 to 10−13 g cm−3 in increments of one order of magnitude. Dotted red lines are column density contours for (from top to bottom) 2.5 × 10²⁰, 2.5 × 10²¹, and 2.5 × 1022 cm−2. The arrows in the second row represent the pressure gradient force. In the right column, only the contours of the PEWIND model are shown. The white circles indicate the extent of the planet’s Hill sphere.
Current usage metrics show cumulative count of Article Views (full-text article views including HTML views, PDF and ePub downloads, according to the available data) and Abstracts Views on Vision4Press platform.
Data correspond to usage on the plateform after 2015. The current usage metrics is available 48-96 hours after online publication and is updated daily on week days.
Initial download of the metrics may take a while.