Fig. B.1
Download original image
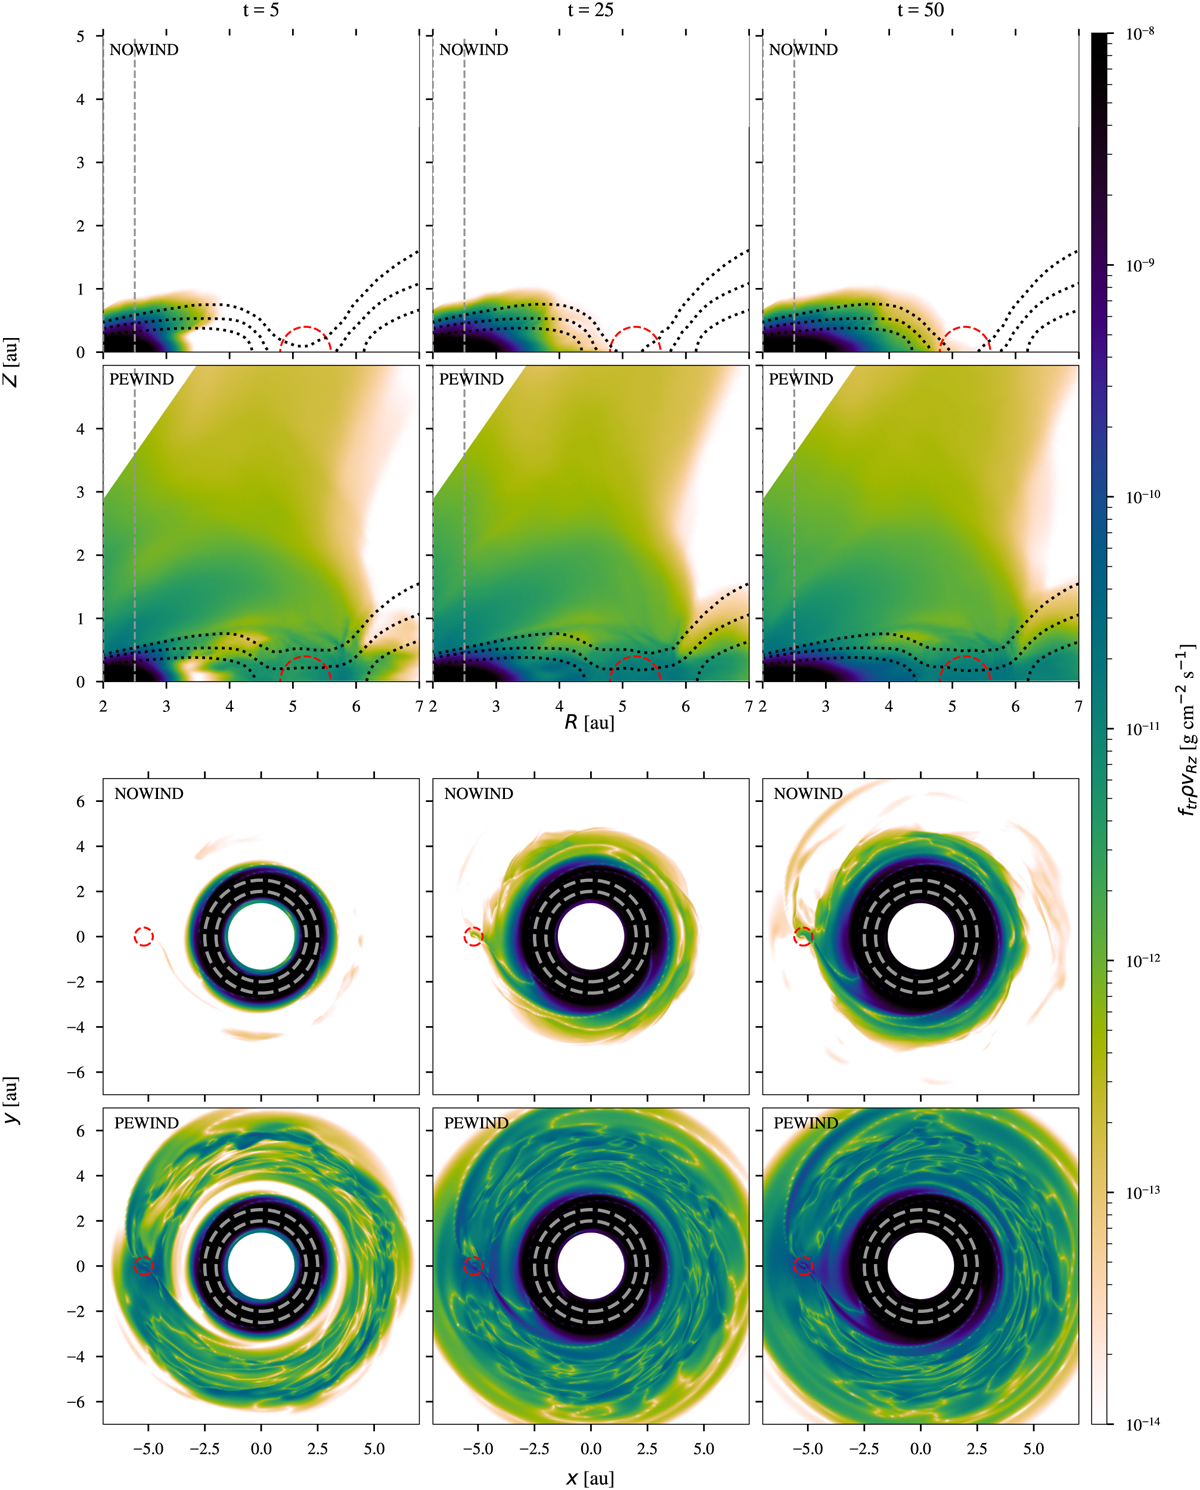
Poloidal mass flux of the gas originating in the innermost radial tracer bin between R = 2 and 2.5 au at t = 5, 25, and 50 orbits. The top panels show the azimuthal average, and the bottom panels show the traced mass flux in the midplane. The dotted black lines are density contours for (from top to bottom) 10−17 to 10−13 g/cm3 in increments of one order of magnitude. The red circle indicates the extent of the planet’s Hill sphere. The dashed grey lines show the boundaries of the radial bin, inside of which the tracer was originally distributed.
Current usage metrics show cumulative count of Article Views (full-text article views including HTML views, PDF and ePub downloads, according to the available data) and Abstracts Views on Vision4Press platform.
Data correspond to usage on the plateform after 2015. The current usage metrics is available 48-96 hours after online publication and is updated daily on week days.
Initial download of the metrics may take a while.