Fig. 13
Download original image
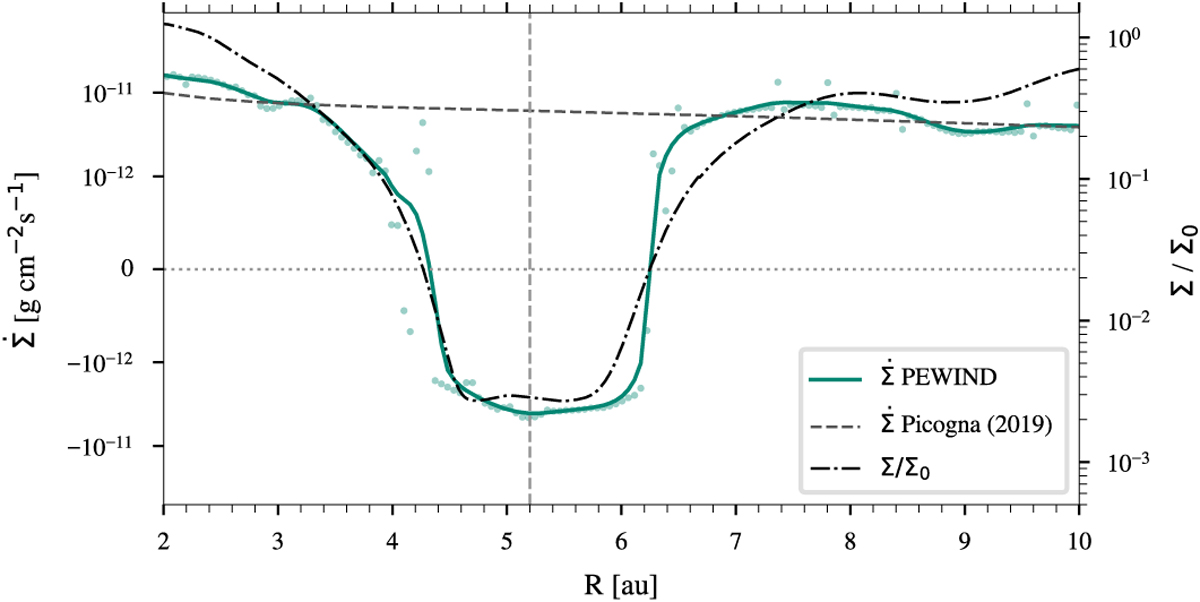
Azimuthally averaged surface mass-loss profile of the PEWIND model. The coloured circles indicate the individual samples and the green solid line is obtained by smoothing the samples using a Gaussian kernel with σ = 3. The dashed black line shows the surface mass-loss profile of the primordial disc by Picogna et al. (2019), which does not have any sub-structures; the vertical dashed line indicates the planet’s location. The dashed-dotted black line shows the 1d surface density profile.
Current usage metrics show cumulative count of Article Views (full-text article views including HTML views, PDF and ePub downloads, according to the available data) and Abstracts Views on Vision4Press platform.
Data correspond to usage on the plateform after 2015. The current usage metrics is available 48-96 hours after online publication and is updated daily on week days.
Initial download of the metrics may take a while.