Open Access
Fig. 12
Download original image
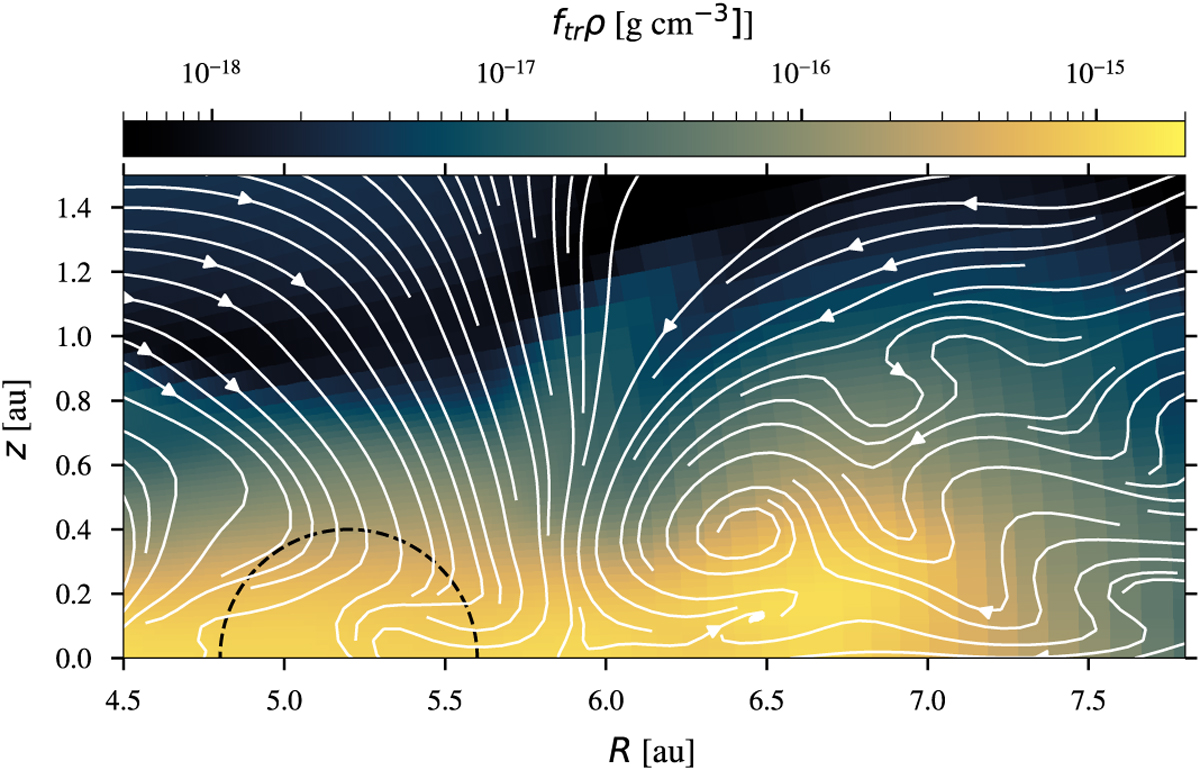
Closeup view of the outer gap edge, showing the density of gas traced by the innermost tracer, i.e. gas that originated between R = 2 and 2.5 au and was transported across the gap. Solid white lines are streamlines, and the dashed black circle indicates the extent of the planet’s Hill sphere.
Current usage metrics show cumulative count of Article Views (full-text article views including HTML views, PDF and ePub downloads, according to the available data) and Abstracts Views on Vision4Press platform.
Data correspond to usage on the plateform after 2015. The current usage metrics is available 48-96 hours after online publication and is updated daily on week days.
Initial download of the metrics may take a while.