Fig. 1
Download original image
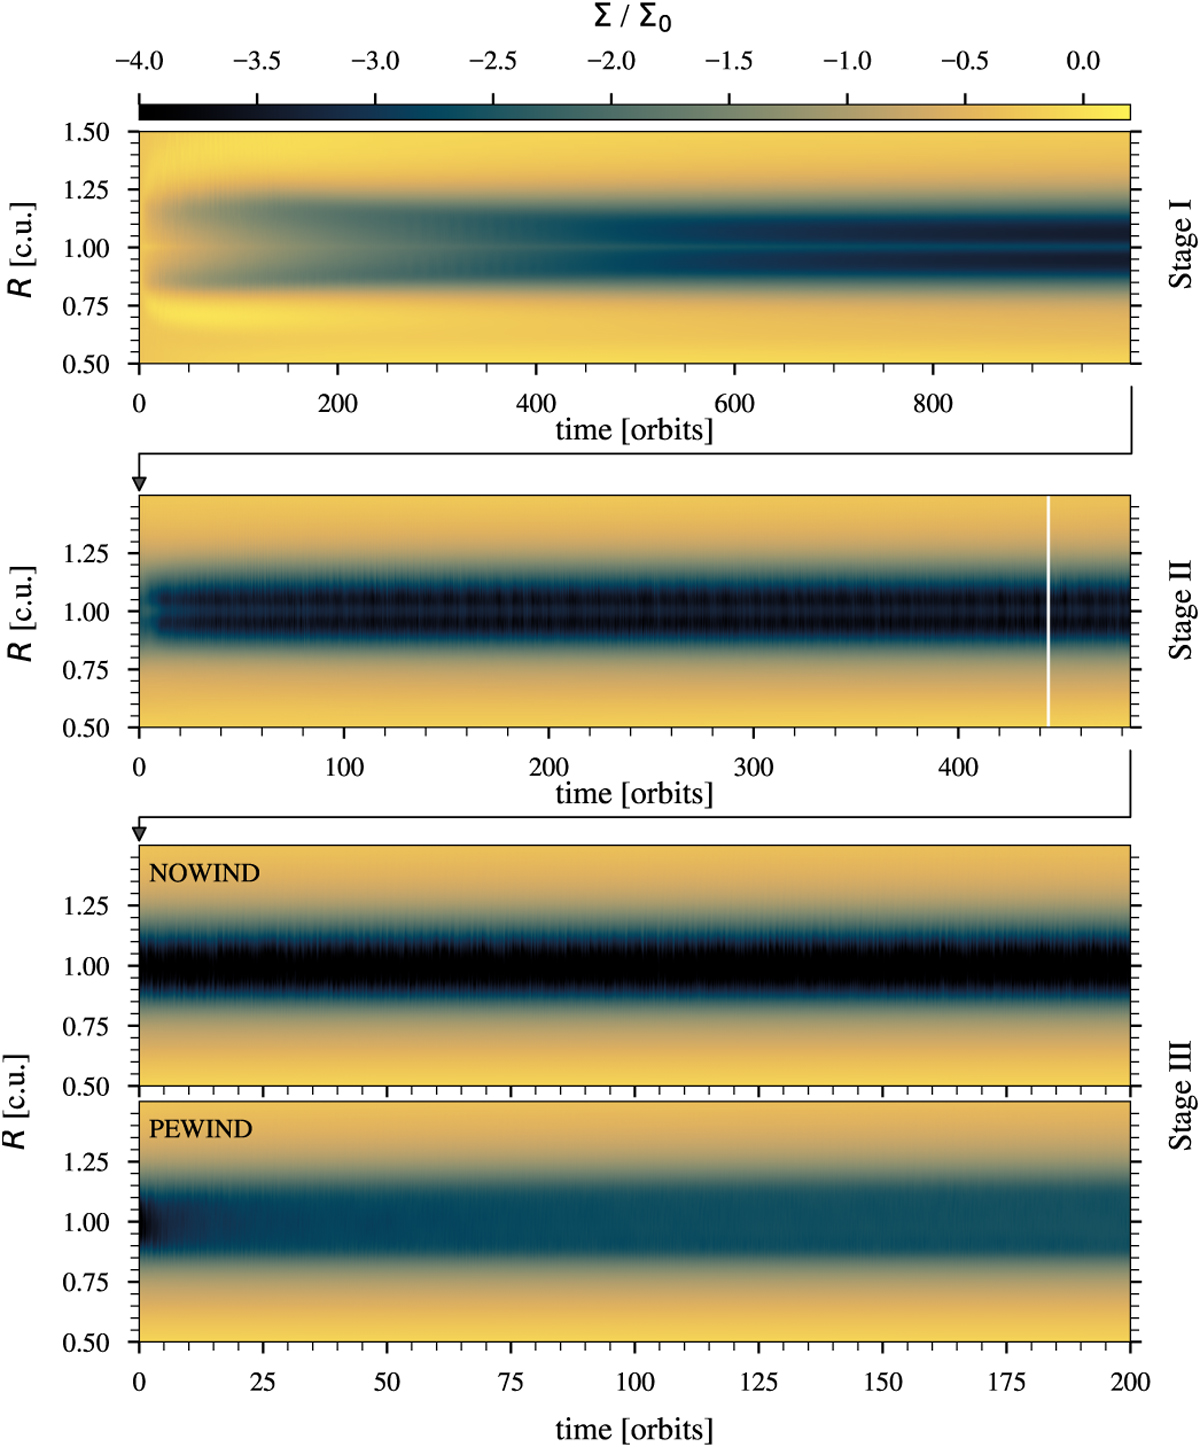
Surface density evolution during the different model stages, normalised by the initial surface density profile. From top to bottom: stage I (2D model), stage II (start of 3D model), and stage III with the NOWIND and PEWIND models, respectively. The white vertical line in the second panel indicates the time at which the model was vertically extended to the final 3D grid (see Sect. 2.3 for details). A black arrow between two panels means that the following stage was started from the end of the previous stage. We note that the scale of the time axis varies between the panels.
Current usage metrics show cumulative count of Article Views (full-text article views including HTML views, PDF and ePub downloads, according to the available data) and Abstracts Views on Vision4Press platform.
Data correspond to usage on the plateform after 2015. The current usage metrics is available 48-96 hours after online publication and is updated daily on week days.
Initial download of the metrics may take a while.