Open Access
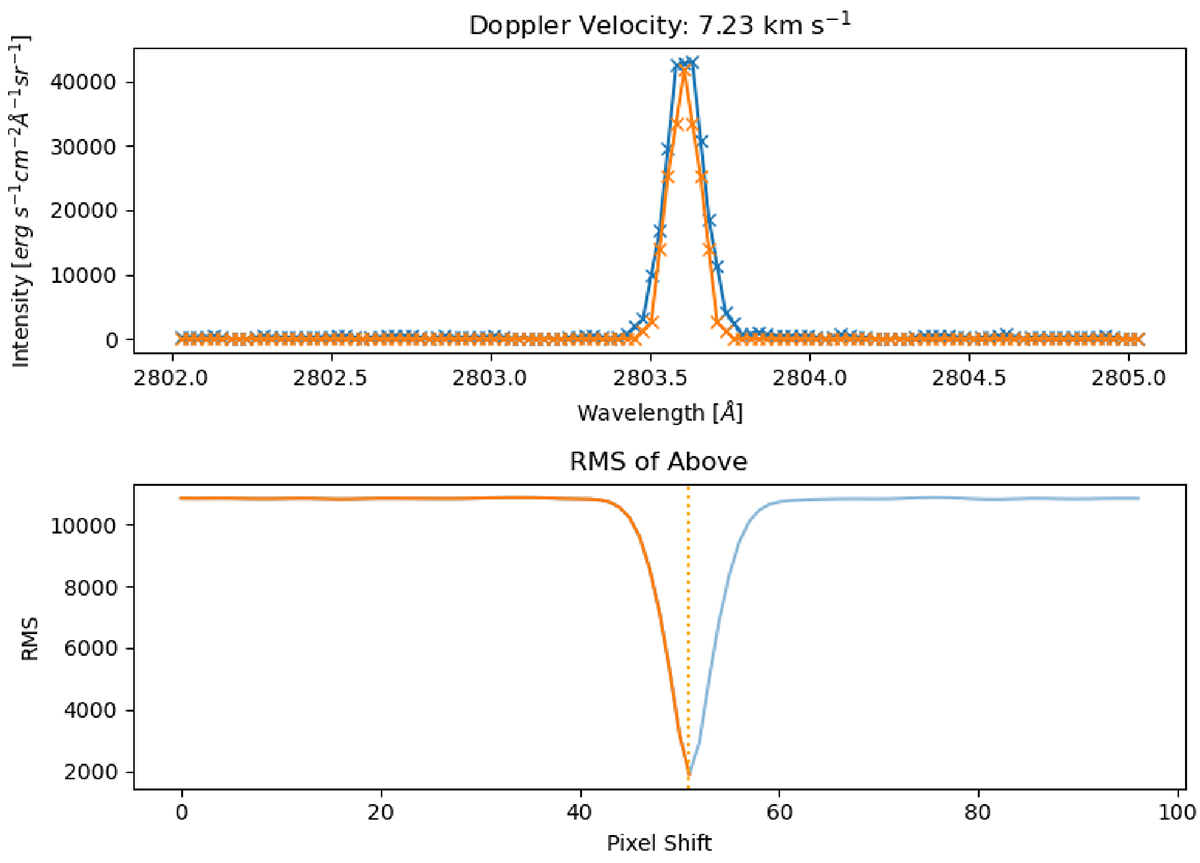
Fig. 7.
Download original image
How rRMS worked. The orange model profile is rolled over the blue observed profile while measuring the RMS and pixel shift (and consequently Doppler velocity) at every wavelength position. This process has been replaced by a cross-correlation in xRMS. This figure is adapted from Peat (2023).
Current usage metrics show cumulative count of Article Views (full-text article views including HTML views, PDF and ePub downloads, according to the available data) and Abstracts Views on Vision4Press platform.
Data correspond to usage on the plateform after 2015. The current usage metrics is available 48-96 hours after online publication and is updated daily on week days.
Initial download of the metrics may take a while.