Fig. 5
Download original image
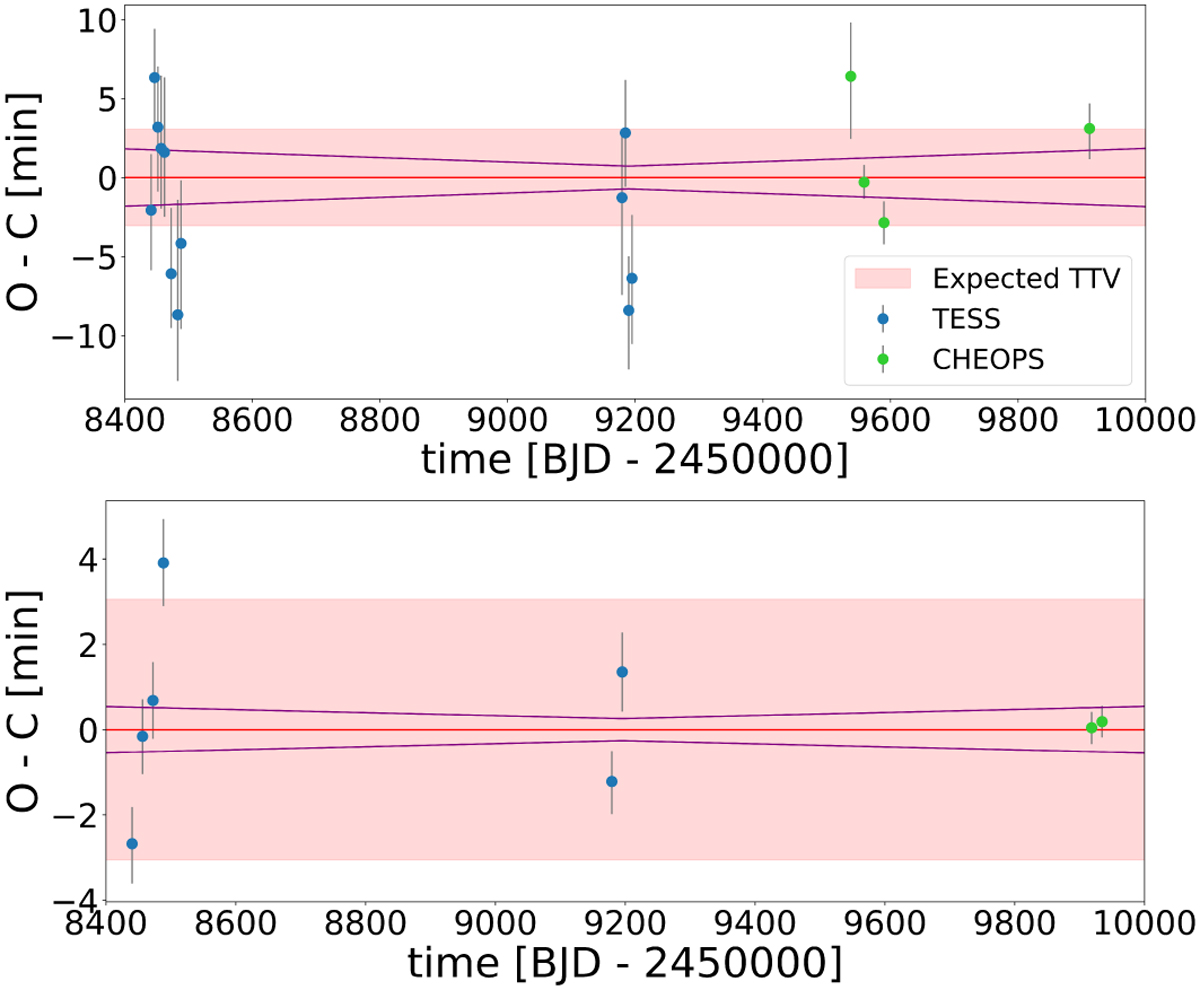
Difference between observed (O) and calculated (C) mid-transit times for TOI-421 b (top) and TOI-421 c (bottom) using observations by TESS (blue) and CHEOPS (green). The red line indicates a difference of zero, which corresponds to no TTVs. The purple lines indicate the 1σ uncertainties of the linear ephemeris. The red area represents the amplitude of the expected variations considering the dynamical interactions of the two planets as computed from the TTVfast code. See text for further details.
Current usage metrics show cumulative count of Article Views (full-text article views including HTML views, PDF and ePub downloads, according to the available data) and Abstracts Views on Vision4Press platform.
Data correspond to usage on the plateform after 2015. The current usage metrics is available 48-96 hours after online publication and is updated daily on week days.
Initial download of the metrics may take a while.