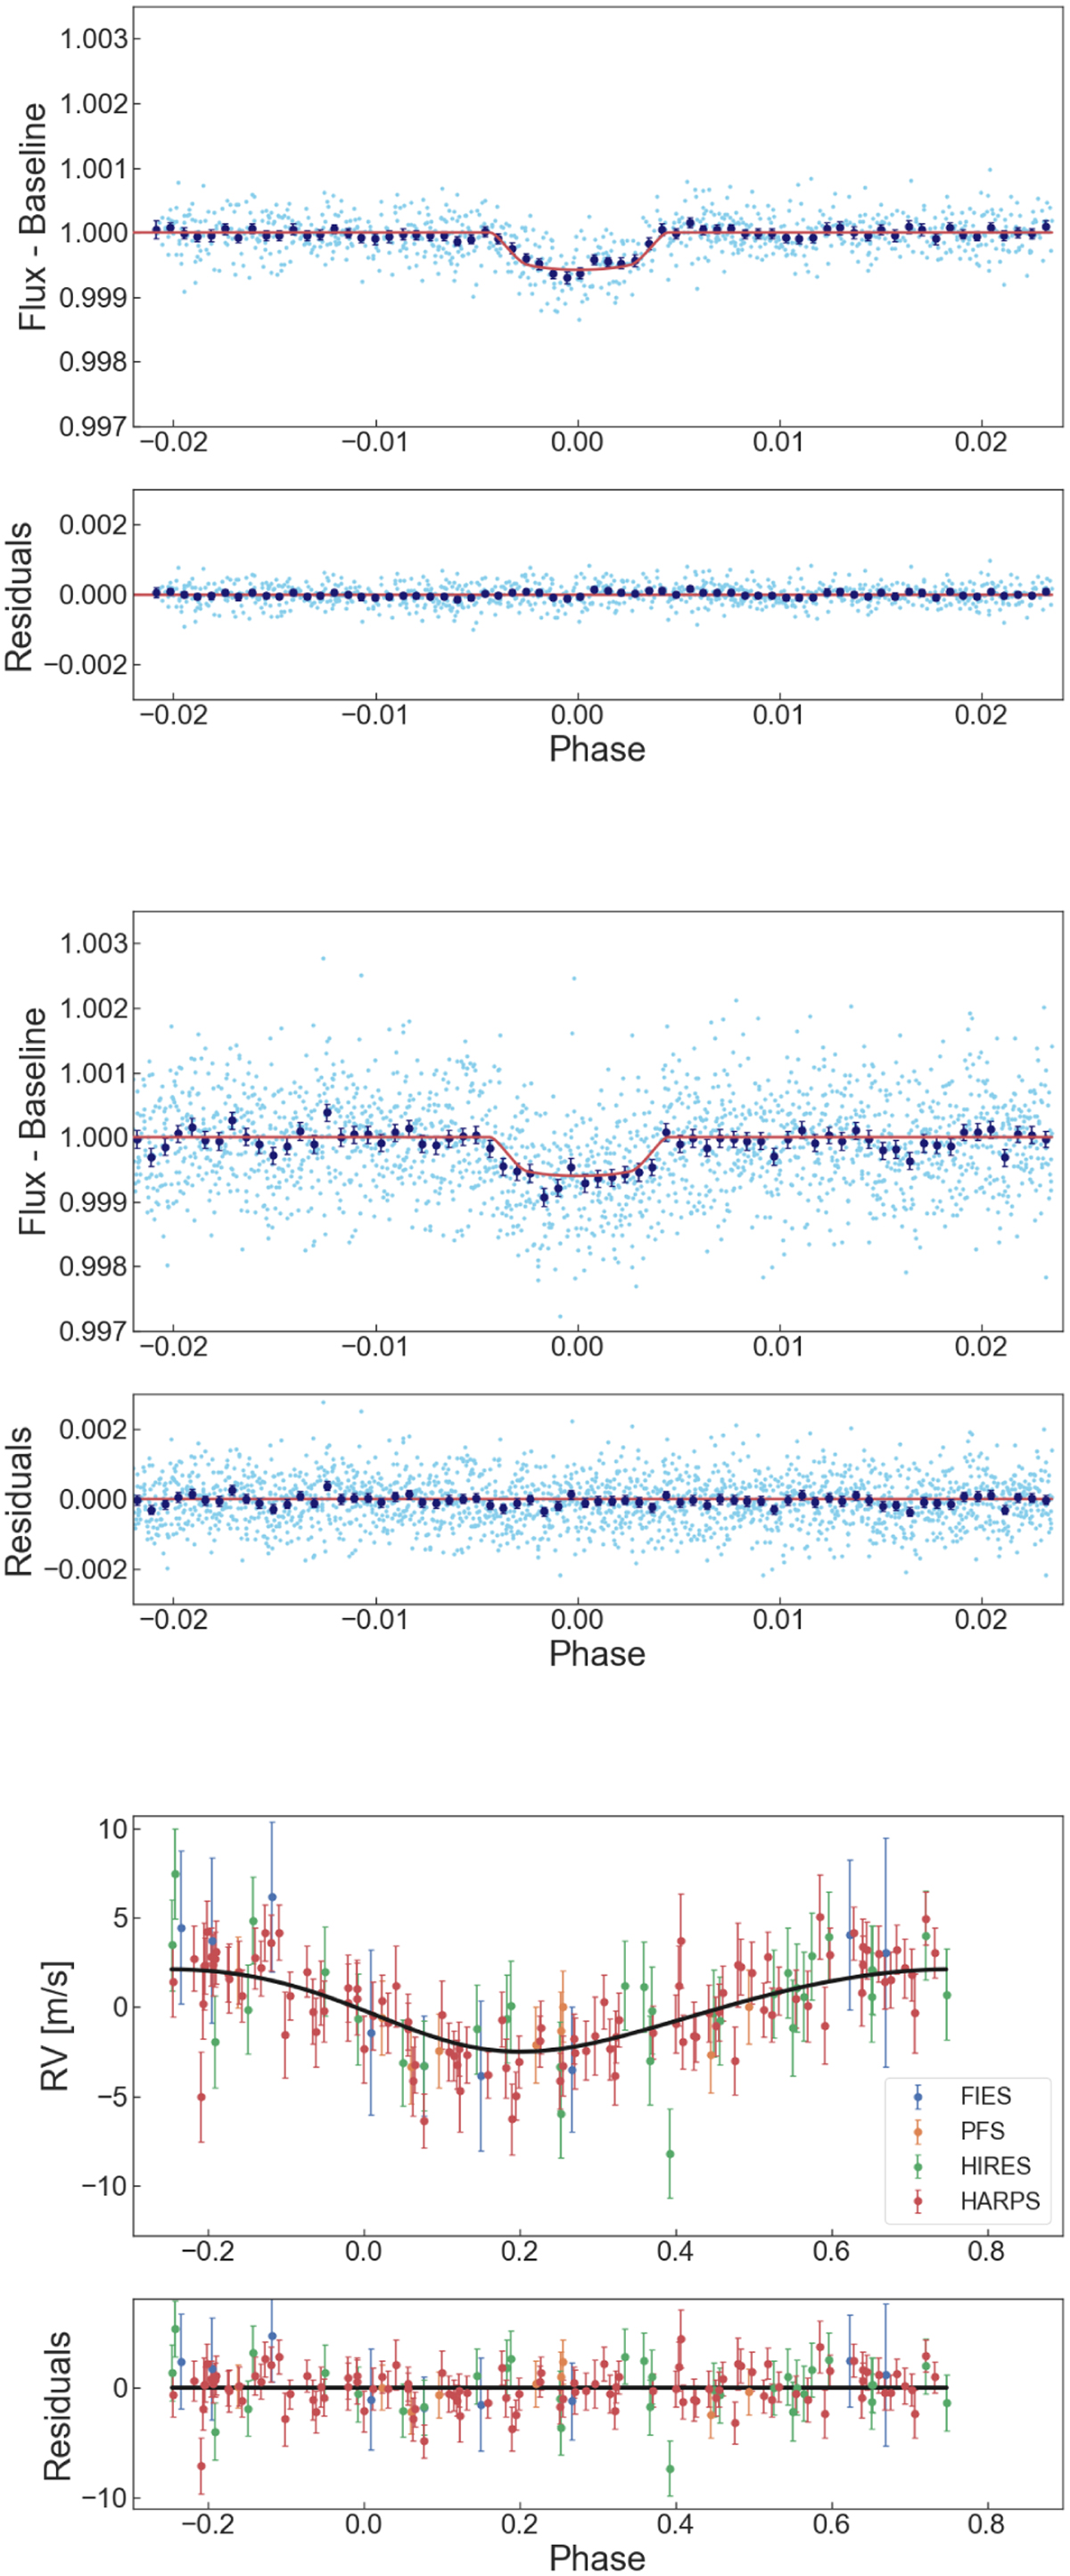
Fig. 2
Download original image
Phase-folded CHEOPS, TESS, and RV data of TOI-421 b. Top panel: phase-folded and detrended transit light curve of TOI-421 b using four CHEOPS visits. The bright and dark blue points are the original data and the 5-min binned data points, respectively. The red line is the median fitted model and the residuals of the fit are shown in the panel below the light curve. Middle panel: same as the top panel, but using TESS data observed during Sectors 5, 6, and 32. Bottom panel: phase-folded and detrended RV data for TOI-421 b using FIES (blue), PFS (yellow), HIRES (green) and HARPS (red). The black line is the median fitted model and the residuals of the fit are shown in the panel below the RV curve. The median fitted model of TOI-421 c has been subtracted from all RV data points.
Current usage metrics show cumulative count of Article Views (full-text article views including HTML views, PDF and ePub downloads, according to the available data) and Abstracts Views on Vision4Press platform.
Data correspond to usage on the plateform after 2015. The current usage metrics is available 48-96 hours after online publication and is updated daily on week days.
Initial download of the metrics may take a while.