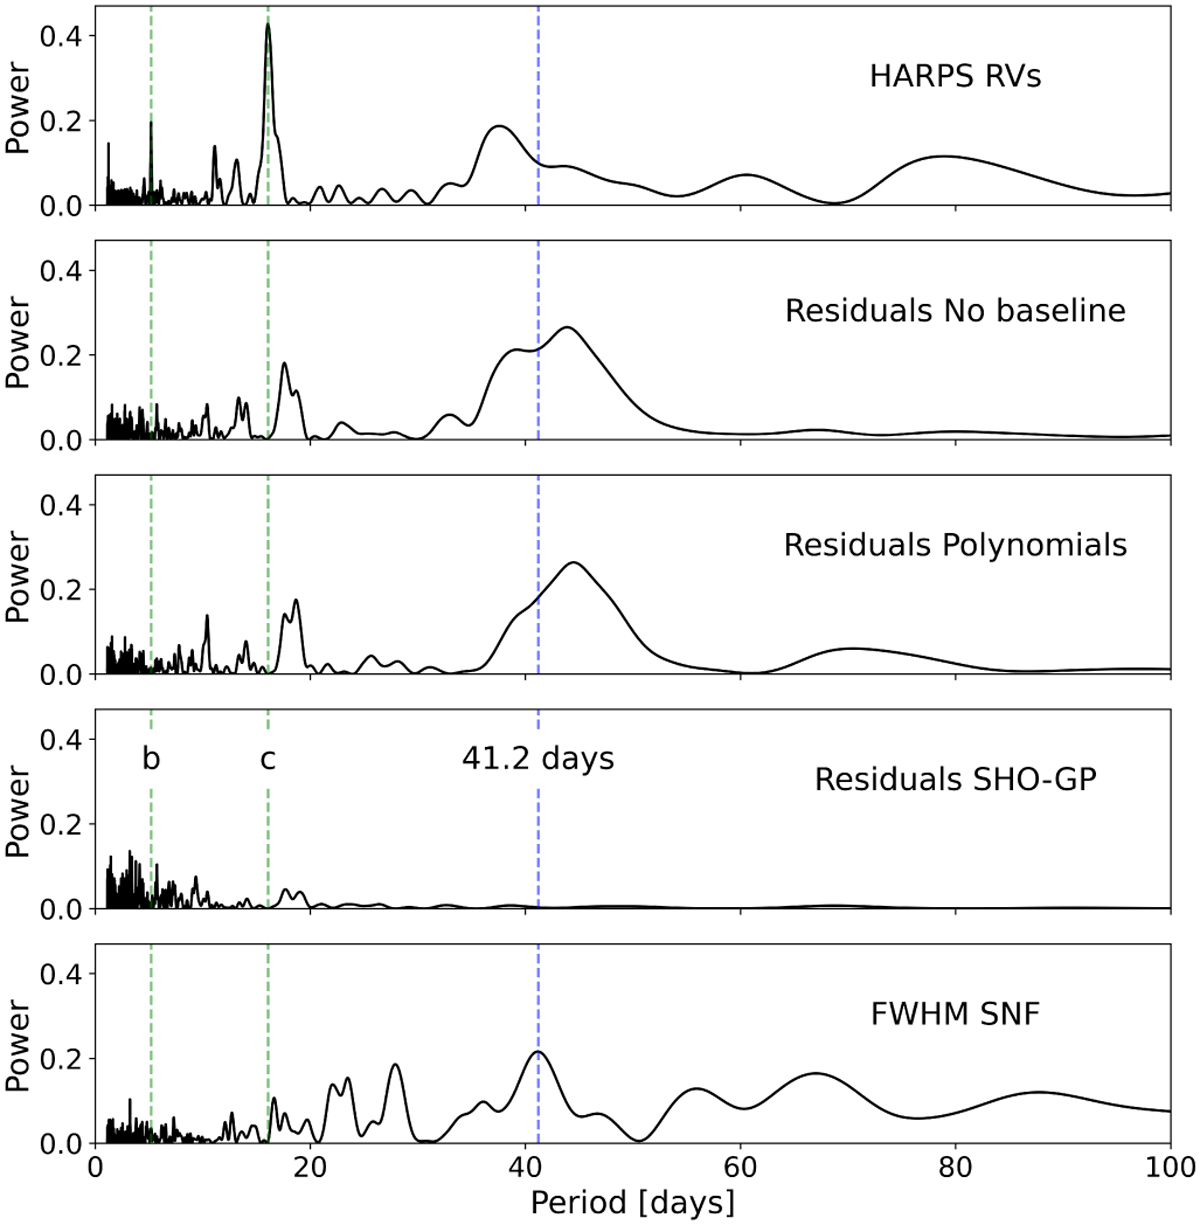
Fig. 1
Download original image
Periodograms of the HARPS SNF data and residuals (i.e. RV – planet signals) when using different baseline models. 1st panel: raw HARPS SNF data. 2nd panel: residuals when fitting only for the planetary signals, without any baseline. 3rd panel: residuals when fitting for the planetary signals and for linear detrending vectors of the activity indicators. 4th panel: residuals when fitting for the planetary signals and employing a SHO-GP as baseline. 5th panel: FWHMSN. The dashed green lines represent the orbital periods of the two known planets. The dashed blue line represents the most significant peak in the periodogram of the FWHMSN activity indicator.
Current usage metrics show cumulative count of Article Views (full-text article views including HTML views, PDF and ePub downloads, according to the available data) and Abstracts Views on Vision4Press platform.
Data correspond to usage on the plateform after 2015. The current usage metrics is available 48-96 hours after online publication and is updated daily on week days.
Initial download of the metrics may take a while.