Fig. 8.
Download original image
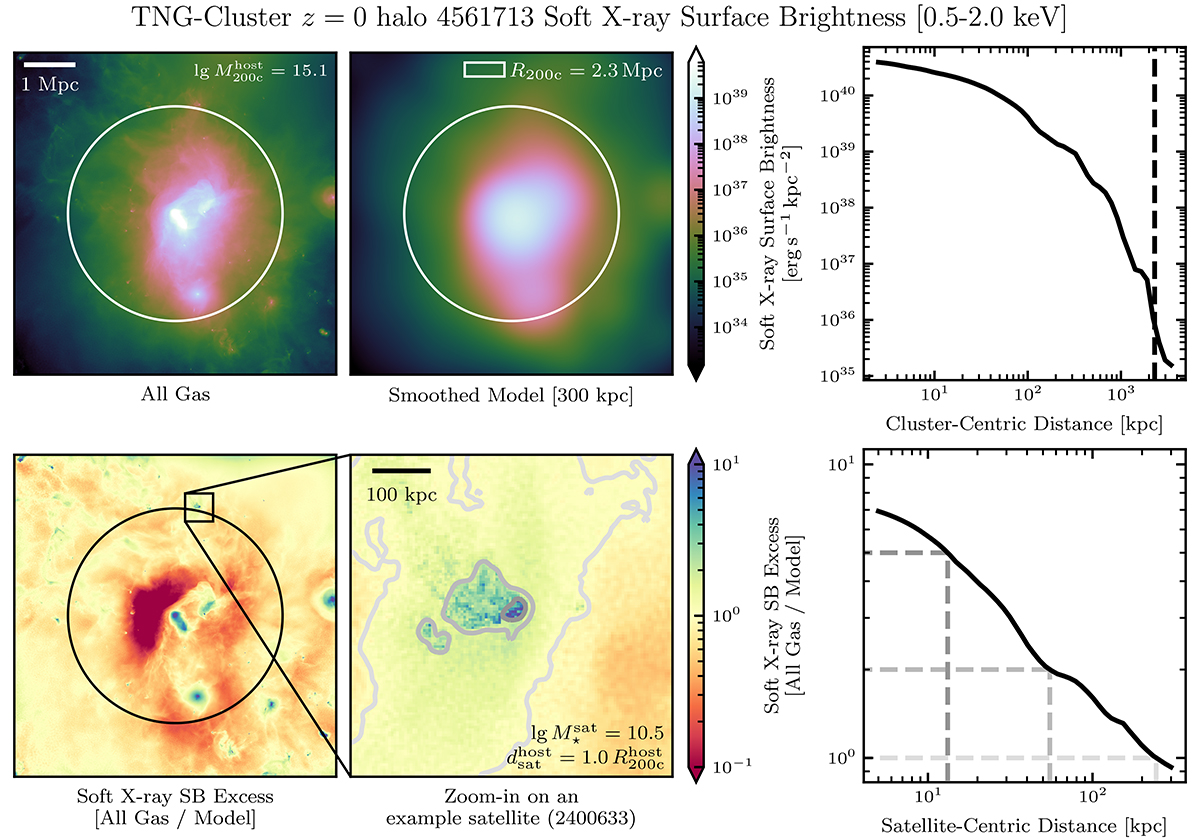
Schematic detailing how we detected satellites’ circumgalactic media and measured their radial profiles. For a given halo (halo mass ![]() ) at z = 0, we compute the soft X-ray (0.5 − 2.0 keV) continuum surface brightness (SB) on 5 × 5 kpc2 pixels (top left). We then smooth the image using a Gaussian kernel of standard deviation 300 kpc (top center). The white circles indicate the virial radius. We include the azimuthally averaged radial profile, where the dashed line marks the virial radius (top right). We compute the soft X-ray surface brightness excess as the ratio of all the gas in the image to the smoothed model (bottom left), and zoom in on an individual example satellite (bottom center; stellar mass
) at z = 0, we compute the soft X-ray (0.5 − 2.0 keV) continuum surface brightness (SB) on 5 × 5 kpc2 pixels (top left). We then smooth the image using a Gaussian kernel of standard deviation 300 kpc (top center). The white circles indicate the virial radius. We include the azimuthally averaged radial profile, where the dashed line marks the virial radius (top right). We compute the soft X-ray surface brightness excess as the ratio of all the gas in the image to the smoothed model (bottom left), and zoom in on an individual example satellite (bottom center; stellar mass ![]() at projected cluster-centric distance
at projected cluster-centric distance ![]() ). We include the contours of {1, 2, 5} times the background on the zoom-in and on the satellite’s excess radial profile (bottom right). In this satellite we detect a soft X-ray surface brightness excess out to ≈200 kpc from the satellite’s center, and the morphology suggests the satellite’s X-ray emitting gas is experiencing environmental effects. The soft X-ray excess profile for this example satellite is similar to others of the same stellar mass and cluster-centric distance (see Fig. 9 and text).
). We include the contours of {1, 2, 5} times the background on the zoom-in and on the satellite’s excess radial profile (bottom right). In this satellite we detect a soft X-ray surface brightness excess out to ≈200 kpc from the satellite’s center, and the morphology suggests the satellite’s X-ray emitting gas is experiencing environmental effects. The soft X-ray excess profile for this example satellite is similar to others of the same stellar mass and cluster-centric distance (see Fig. 9 and text).
Current usage metrics show cumulative count of Article Views (full-text article views including HTML views, PDF and ePub downloads, according to the available data) and Abstracts Views on Vision4Press platform.
Data correspond to usage on the plateform after 2015. The current usage metrics is available 48-96 hours after online publication and is updated daily on week days.
Initial download of the metrics may take a while.