Fig. 5.
Download original image
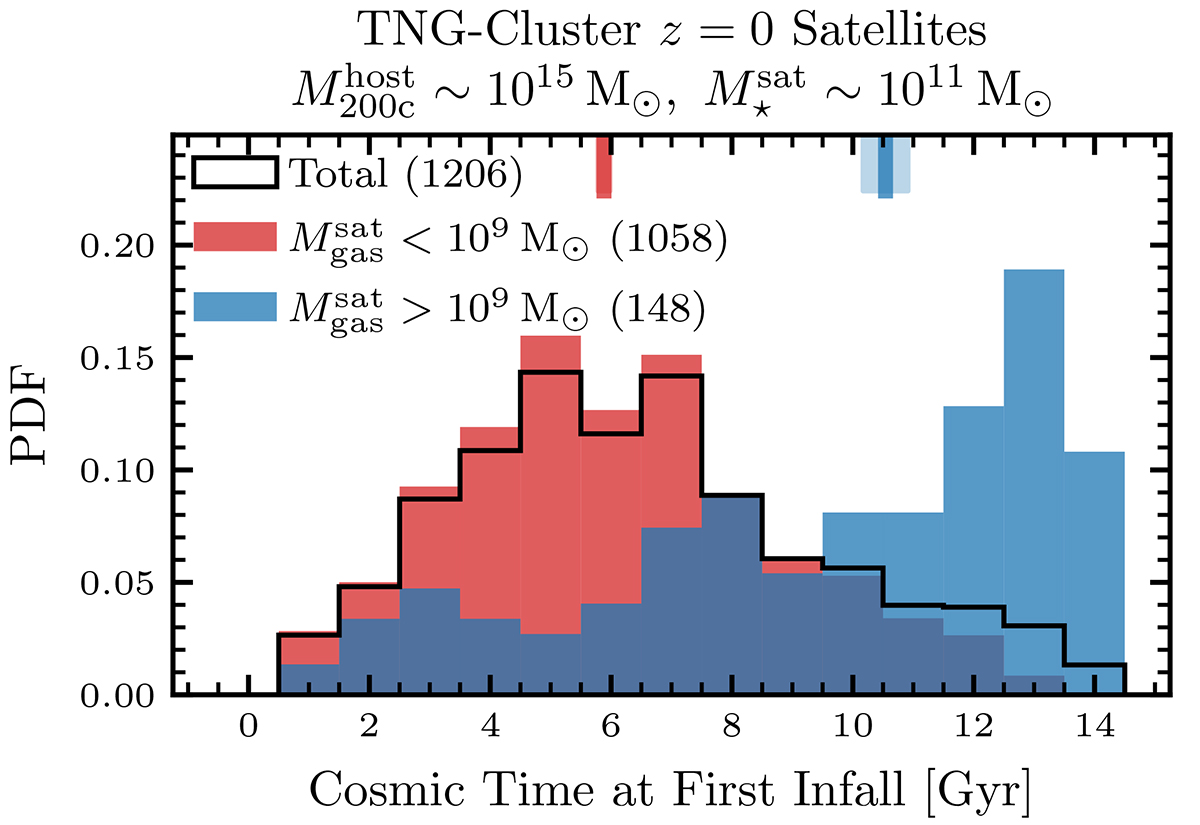
Gas-rich satellites today are typically late infallers. We plot the probability distribution functions (PDFs) of the infall times of all (black), gas-poor ![]() (red), and gas-rich
(red), and gas-rich ![]() (blue) TNG-Cluster satellites at a fixed host halo
(blue) TNG-Cluster satellites at a fixed host halo ![]() and satellite stellar
and satellite stellar ![]() mass. We mark the medians and errors of the distributions as hashes on the top x-axis. The infall time is the first infall into any host, regardless if the galaxy has been preprocessed or not. At a fixed host halo and satellite stellar mass, the infall time is the primary driver determining whether satellites remain gas-rich or gas-poor today: more recent infallers are more likely to retain large gas reservoirs.
mass. We mark the medians and errors of the distributions as hashes on the top x-axis. The infall time is the first infall into any host, regardless if the galaxy has been preprocessed or not. At a fixed host halo and satellite stellar mass, the infall time is the primary driver determining whether satellites remain gas-rich or gas-poor today: more recent infallers are more likely to retain large gas reservoirs.
Current usage metrics show cumulative count of Article Views (full-text article views including HTML views, PDF and ePub downloads, according to the available data) and Abstracts Views on Vision4Press platform.
Data correspond to usage on the plateform after 2015. The current usage metrics is available 48-96 hours after online publication and is updated daily on week days.
Initial download of the metrics may take a while.