Fig. 3.
Download original image
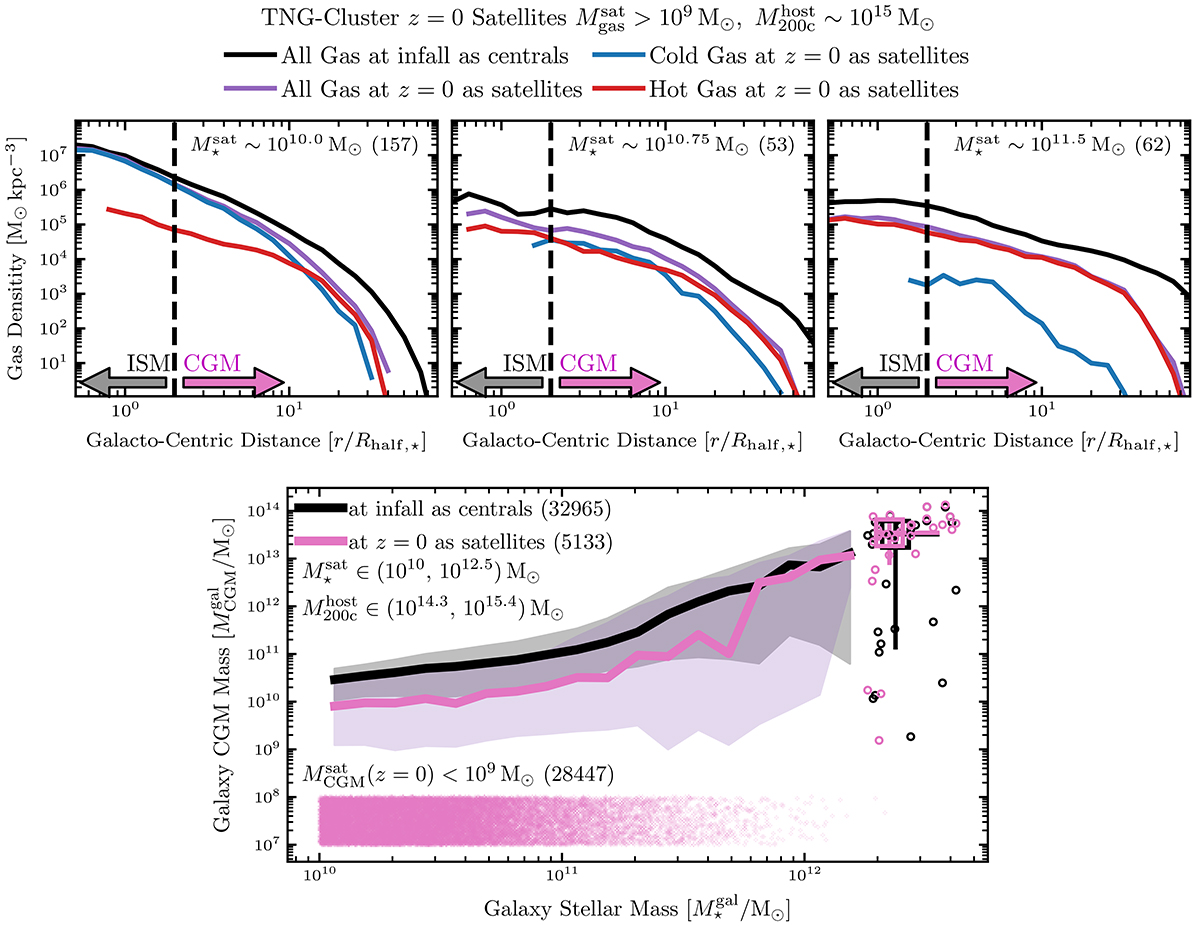
Spatial extent of satellite gas in TNG-Cluster. Of the ≈5000 gas-rich ![]() massive satellites
massive satellites ![]() at z = 0, we examine the spatial extent of all (hot and cold) gas at a fixed host cluster mass
at z = 0, we examine the spatial extent of all (hot and cold) gas at a fixed host cluster mass ![]() and at three stellar masses
and at three stellar masses ![]() , 1010.75, 1011.5 M⊙ (top panels, left to right respectively). Moreover, we compare the total gas density (purple) at z = 0 of cluster members as satellites with that at infall as centrals (black). All curves show the median profiles of all galaxies in the bin; see Fig. 4 for the individual profiles to see the galaxy-to-galaxy variation. We define all gas outside > 2 Rhalf, ⋆ as the circumgalactic medium (CGM). We then plot total CGM mass
, 1010.75, 1011.5 M⊙ (top panels, left to right respectively). Moreover, we compare the total gas density (purple) at z = 0 of cluster members as satellites with that at infall as centrals (black). All curves show the median profiles of all galaxies in the bin; see Fig. 4 for the individual profiles to see the galaxy-to-galaxy variation. We define all gas outside > 2 Rhalf, ⋆ as the circumgalactic medium (CGM). We then plot total CGM mass ![]() as a function of galaxy stellar mass
as a function of galaxy stellar mass ![]() (bottom panel) at infall as centrals (black), and at z = 0 as satellites (pink). The curves are the medians of the CGM masses (only the galaxies with nonzero CGM mass for the satellites), and for the most massive galaxies we plot the individual objects (circles) and the median stacks (squares). We manually place the ≈28 000 CGM-poor
(bottom panel) at infall as centrals (black), and at z = 0 as satellites (pink). The curves are the medians of the CGM masses (only the galaxies with nonzero CGM mass for the satellites), and for the most massive galaxies we plot the individual objects (circles) and the median stacks (squares). We manually place the ≈28 000 CGM-poor ![]() satellites at masses ∼107 − 8 M⊙. All stacks use stellar, host, and gas masses at z = 0, and the radial profiles are normalized to Rhalf, ⋆ at the considered time (infall or today). More than 5000 cluster satellites retain a CGM despite residing in harsh cluster environments.
satellites at masses ∼107 − 8 M⊙. All stacks use stellar, host, and gas masses at z = 0, and the radial profiles are normalized to Rhalf, ⋆ at the considered time (infall or today). More than 5000 cluster satellites retain a CGM despite residing in harsh cluster environments.
Current usage metrics show cumulative count of Article Views (full-text article views including HTML views, PDF and ePub downloads, according to the available data) and Abstracts Views on Vision4Press platform.
Data correspond to usage on the plateform after 2015. The current usage metrics is available 48-96 hours after online publication and is updated daily on week days.
Initial download of the metrics may take a while.