Fig. 2.
Download original image
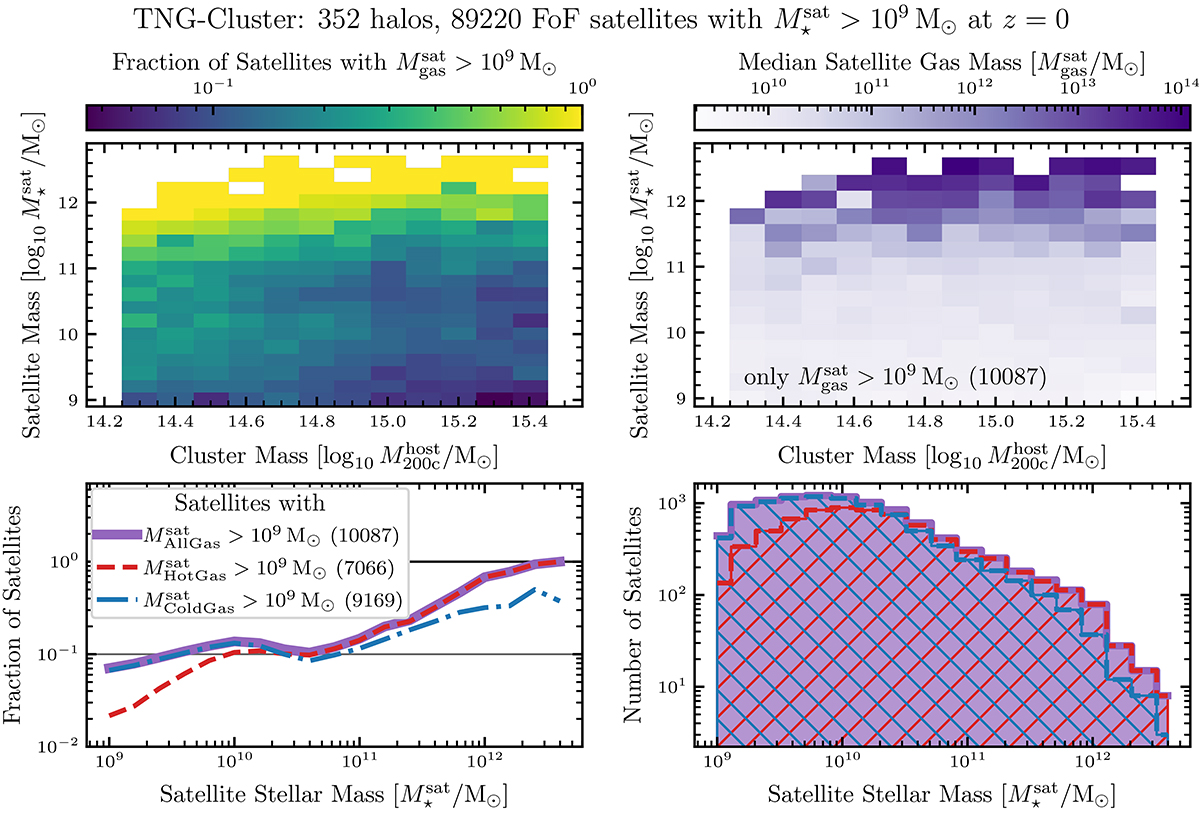
How the TNG-Cluster satellite gas mass varies with the satellite stellar and host halo mass. Top left panel: for the ≈90 000 TNG-Cluster satellites with ![]() , the fraction of satellites that retain gas reservoirs
, the fraction of satellites that retain gas reservoirs ![]() today as satellites is shown in bins of satellite stellar
today as satellites is shown in bins of satellite stellar ![]() and cluster
and cluster ![]() mass. Top right panel: only 10 000 (10%) of the TNG-Cluster satellites retain gas masses
mass. Top right panel: only 10 000 (10%) of the TNG-Cluster satellites retain gas masses ![]() today. For these gaseous satellites, we show the median satellite gas mass
today. For these gaseous satellites, we show the median satellite gas mass ![]() in bins of satellite stellar
in bins of satellite stellar ![]() and host halo
and host halo ![]() mass. Bottom panels: we show the fractions (left panel) and numbers (right panel) of satellites with all (purple, solid, filled), hot (red, dashed, “\” hatched), and cold (blue, dashed-dotted, “/” hatched) gas masses > 109 M⊙ within a given stellar mass bin at z = 0. We mark 100% and the global average of 10% with black lines, and include the total number of gaseous satellites in the legend. While a given satellite is more likely to retain gas if it has a higher stellar mass, a given gaseous satellite is more likely to have a lower stellar mass because there are simply more lower-mass satellites.
mass. Bottom panels: we show the fractions (left panel) and numbers (right panel) of satellites with all (purple, solid, filled), hot (red, dashed, “\” hatched), and cold (blue, dashed-dotted, “/” hatched) gas masses > 109 M⊙ within a given stellar mass bin at z = 0. We mark 100% and the global average of 10% with black lines, and include the total number of gaseous satellites in the legend. While a given satellite is more likely to retain gas if it has a higher stellar mass, a given gaseous satellite is more likely to have a lower stellar mass because there are simply more lower-mass satellites.
Current usage metrics show cumulative count of Article Views (full-text article views including HTML views, PDF and ePub downloads, according to the available data) and Abstracts Views on Vision4Press platform.
Data correspond to usage on the plateform after 2015. The current usage metrics is available 48-96 hours after online publication and is updated daily on week days.
Initial download of the metrics may take a while.