Fig. A.1.
Download original image
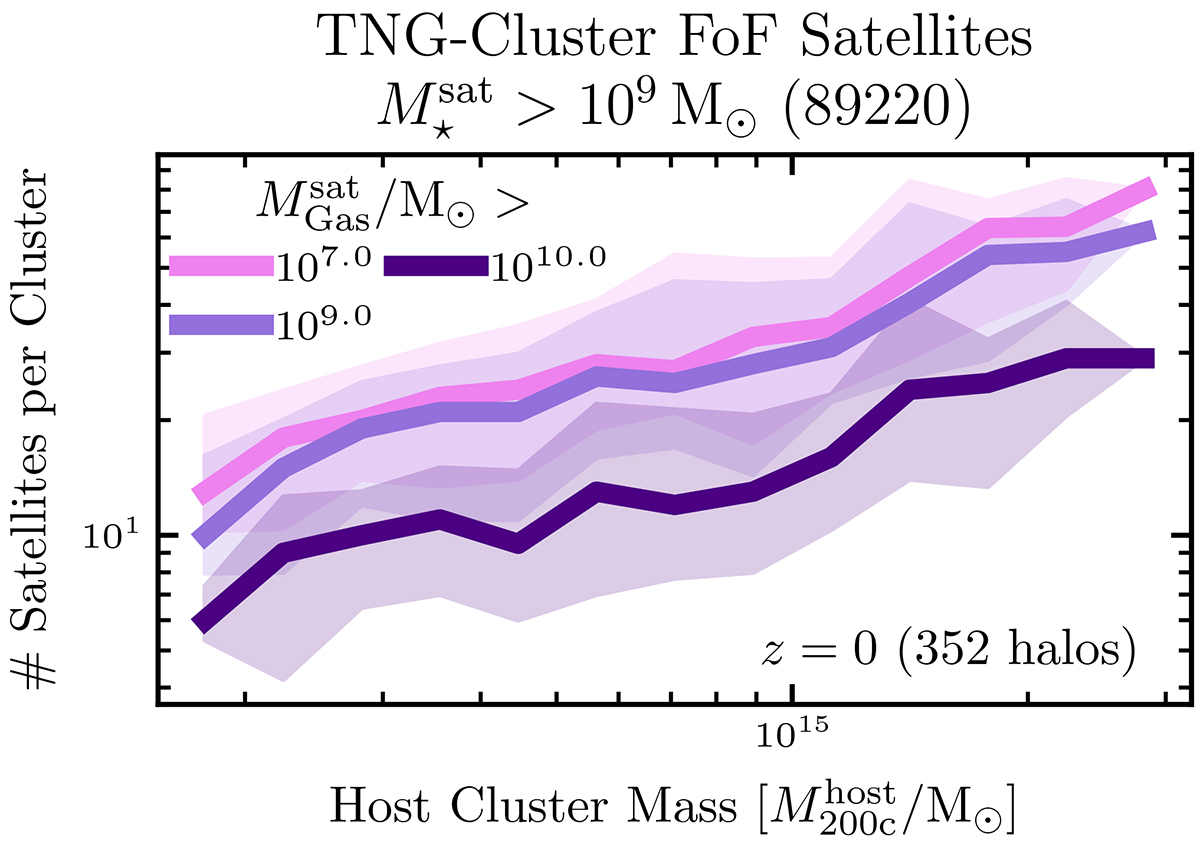
Similar to Fig. 1 (bottom left panel) except we show the number of satellites per host with a given gas mass ![]() or higher. The medians and 16th and 84th percentiles are the solid curves and shaded regions respectively. The number of satellites per host above a given gas mass increases with host mass. While ≈90 percent of satellites have gas masses
or higher. The medians and 16th and 84th percentiles are the solid curves and shaded regions respectively. The number of satellites per host above a given gas mass increases with host mass. While ≈90 percent of satellites have gas masses ![]() , 90 percent of those with gas mass
, 90 percent of those with gas mass ![]() (∼1 gas cell) actually have
(∼1 gas cell) actually have ![]() (≈100 gas cells), suggesting that the gaseous TNG-Cluster satellites are sufficiently resolved.
(≈100 gas cells), suggesting that the gaseous TNG-Cluster satellites are sufficiently resolved.
Current usage metrics show cumulative count of Article Views (full-text article views including HTML views, PDF and ePub downloads, according to the available data) and Abstracts Views on Vision4Press platform.
Data correspond to usage on the plateform after 2015. The current usage metrics is available 48-96 hours after online publication and is updated daily on week days.
Initial download of the metrics may take a while.