Fig. 1.
Download original image
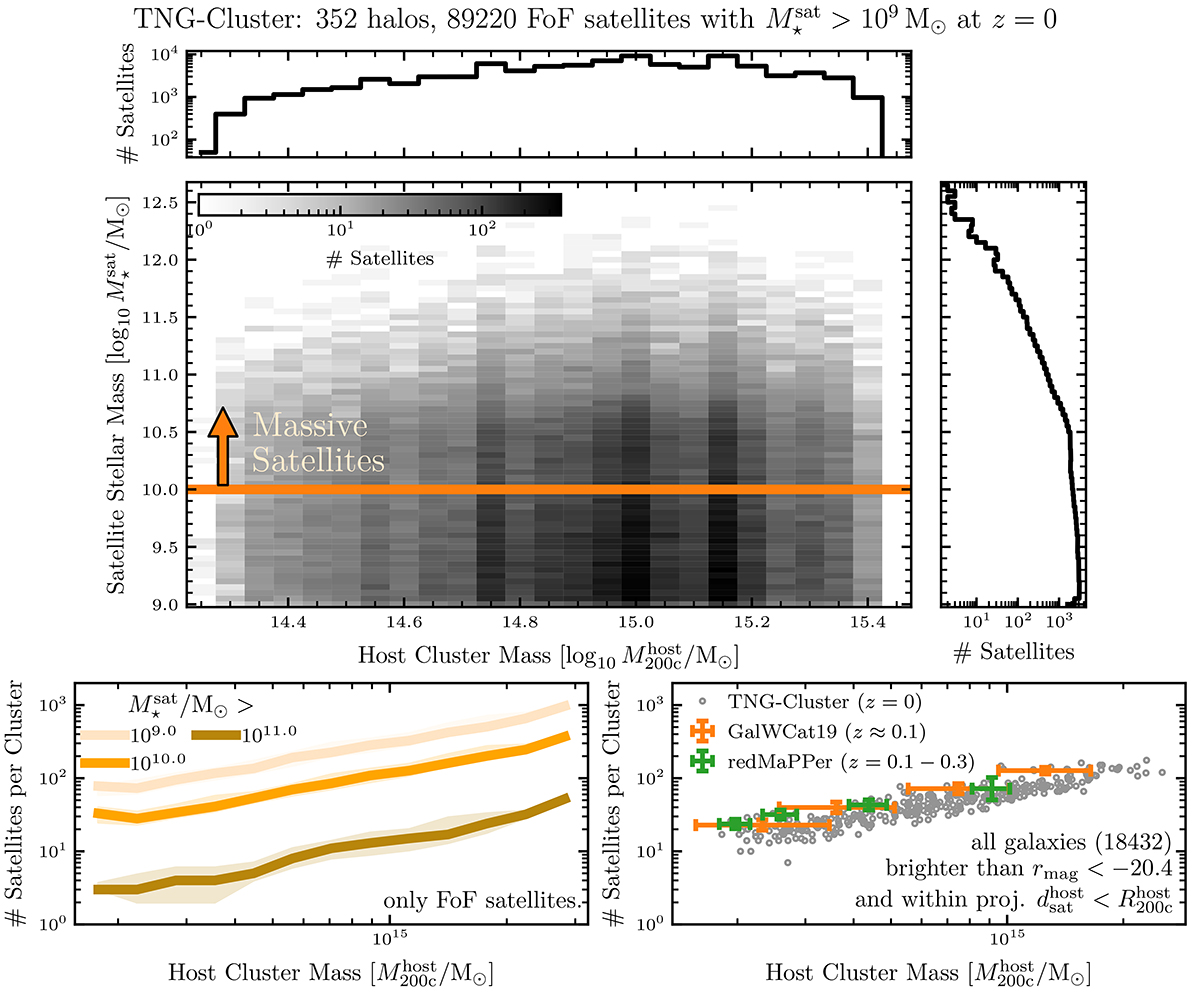
Cluster and satellite demographics in TNG-Cluster. Top panels: we plot the number of satellite galaxies of the 352 clusters in bins of satellite stellar ![]() and host halo
and host halo ![]() mass at z = 0. The one-dimensional histograms for
mass at z = 0. The one-dimensional histograms for ![]() and
and ![]() are included in the right and top panels. The number of satellites per stellar mass bin decreases with satellite stellar mass, where there is a sharp decrease in the number of super-L⋆ galaxies
are included in the right and top panels. The number of satellites per stellar mass bin decreases with satellite stellar mass, where there is a sharp decrease in the number of super-L⋆ galaxies ![]() . The number of satellites per host mass bin increases at lower cluster masses
. The number of satellites per host mass bin increases at lower cluster masses ![]() , and then decreases for the most massive clusters
, and then decreases for the most massive clusters ![]() , which reflects the TNG-Cluster halo mass function (see text and Nelson et al. 2024 for details). Bottom panels: for each of the 352 hosts, we plot the number of FoF satellites above given stellar masses (left), where the medians and 16th and 84th percentiles are the solid curves and shaded regions respectively. Additionally, we qualitatively compare the TNG-Cluster results to spectroscopic (GalWCat19; Abdullah et al. 2020, 2023) and photometric (redMaPPer; Costanzi et al. 2019) SDSS observations, considering all galaxies brighter than rmag < −20.4 and within a projected distance
, which reflects the TNG-Cluster halo mass function (see text and Nelson et al. 2024 for details). Bottom panels: for each of the 352 hosts, we plot the number of FoF satellites above given stellar masses (left), where the medians and 16th and 84th percentiles are the solid curves and shaded regions respectively. Additionally, we qualitatively compare the TNG-Cluster results to spectroscopic (GalWCat19; Abdullah et al. 2020, 2023) and photometric (redMaPPer; Costanzi et al. 2019) SDSS observations, considering all galaxies brighter than rmag < −20.4 and within a projected distance ![]() as satellites (right panel; see text for details). The TNG-Cluster mass-richness relation is qualitatively consistent with observations.
as satellites (right panel; see text for details). The TNG-Cluster mass-richness relation is qualitatively consistent with observations.
Current usage metrics show cumulative count of Article Views (full-text article views including HTML views, PDF and ePub downloads, according to the available data) and Abstracts Views on Vision4Press platform.
Data correspond to usage on the plateform after 2015. The current usage metrics is available 48-96 hours after online publication and is updated daily on week days.
Initial download of the metrics may take a while.