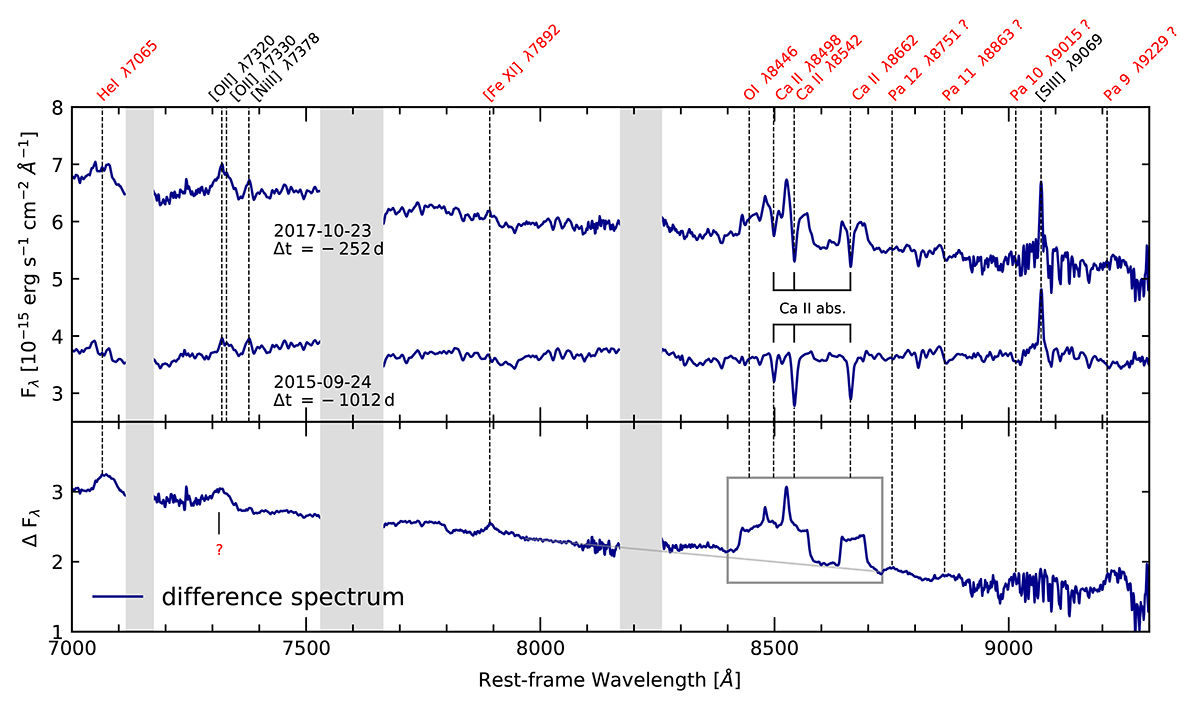
Fig. 9.
Download original image
Intercalibrated MUSE NIR spectra from 2015 September 24 and 2017 October 23 (upper panel) and the resulting difference spectrum (lower panel). The most prominent telluric absorption bands are shown in gray. In addition to an increase in NIR continuum flux, the difference spectrum reveals emission from several broad lines and [Fe XI] λ7892. The most prominent emission feature is the blend of O Iλ8446 and the Ca IIλλ8498, 8542, 8662 triplet (gray box). The linear pseudo-continuum used for later analysis is shown as a gray line. The positions of all identified emission lines are marked by dashed lines. Narrow emission lines and the stellar Ca II triplet absorption are denoted in black, while variable line emission is denoted in red.
Current usage metrics show cumulative count of Article Views (full-text article views including HTML views, PDF and ePub downloads, according to the available data) and Abstracts Views on Vision4Press platform.
Data correspond to usage on the plateform after 2015. The current usage metrics is available 48-96 hours after online publication and is updated daily on week days.
Initial download of the metrics may take a while.