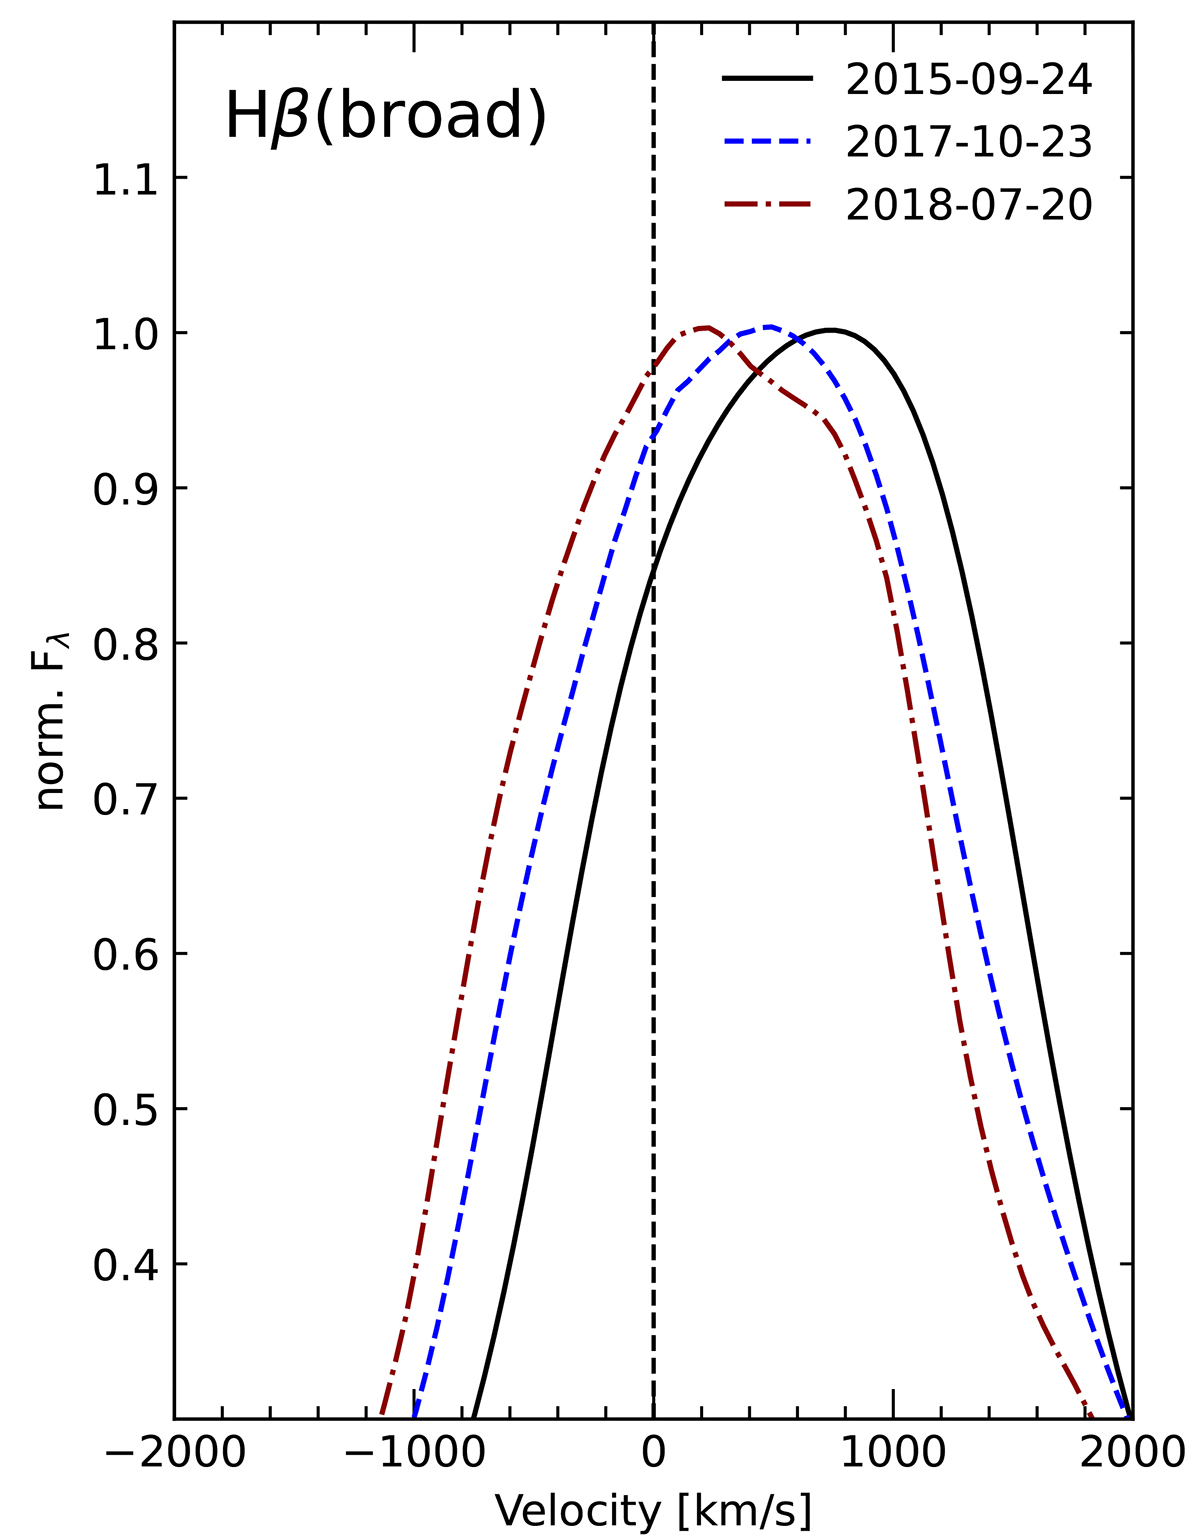
Fig. 8.
Download original image
Blueward drift of the normalized Hβ profiles in velocity space (from Spectrum 1 (2015 September 24) to Spectrum 2 (2017 October 23), and Spectrum 3 (2018 July 20)) after subtraction of the narrow-line and the host-galaxy contribution. The Hβ profile from Spectrum 1 is the reconstructed Hβ profile (see Sect. 3.3). The blueward drift of the Hβ profile during the rising phase is clearly visible. The redshift of the Hβ line shifts from +(730 ± 50) km s−1 to +(490 ± 50) km s−1 and +(360 ± 50) km s−1 from Spectrum 1 to Spectrum 2 and Spectrum 3, respectively.
Current usage metrics show cumulative count of Article Views (full-text article views including HTML views, PDF and ePub downloads, according to the available data) and Abstracts Views on Vision4Press platform.
Data correspond to usage on the plateform after 2015. The current usage metrics is available 48-96 hours after online publication and is updated daily on week days.
Initial download of the metrics may take a while.