Fig. 7.
Download original image
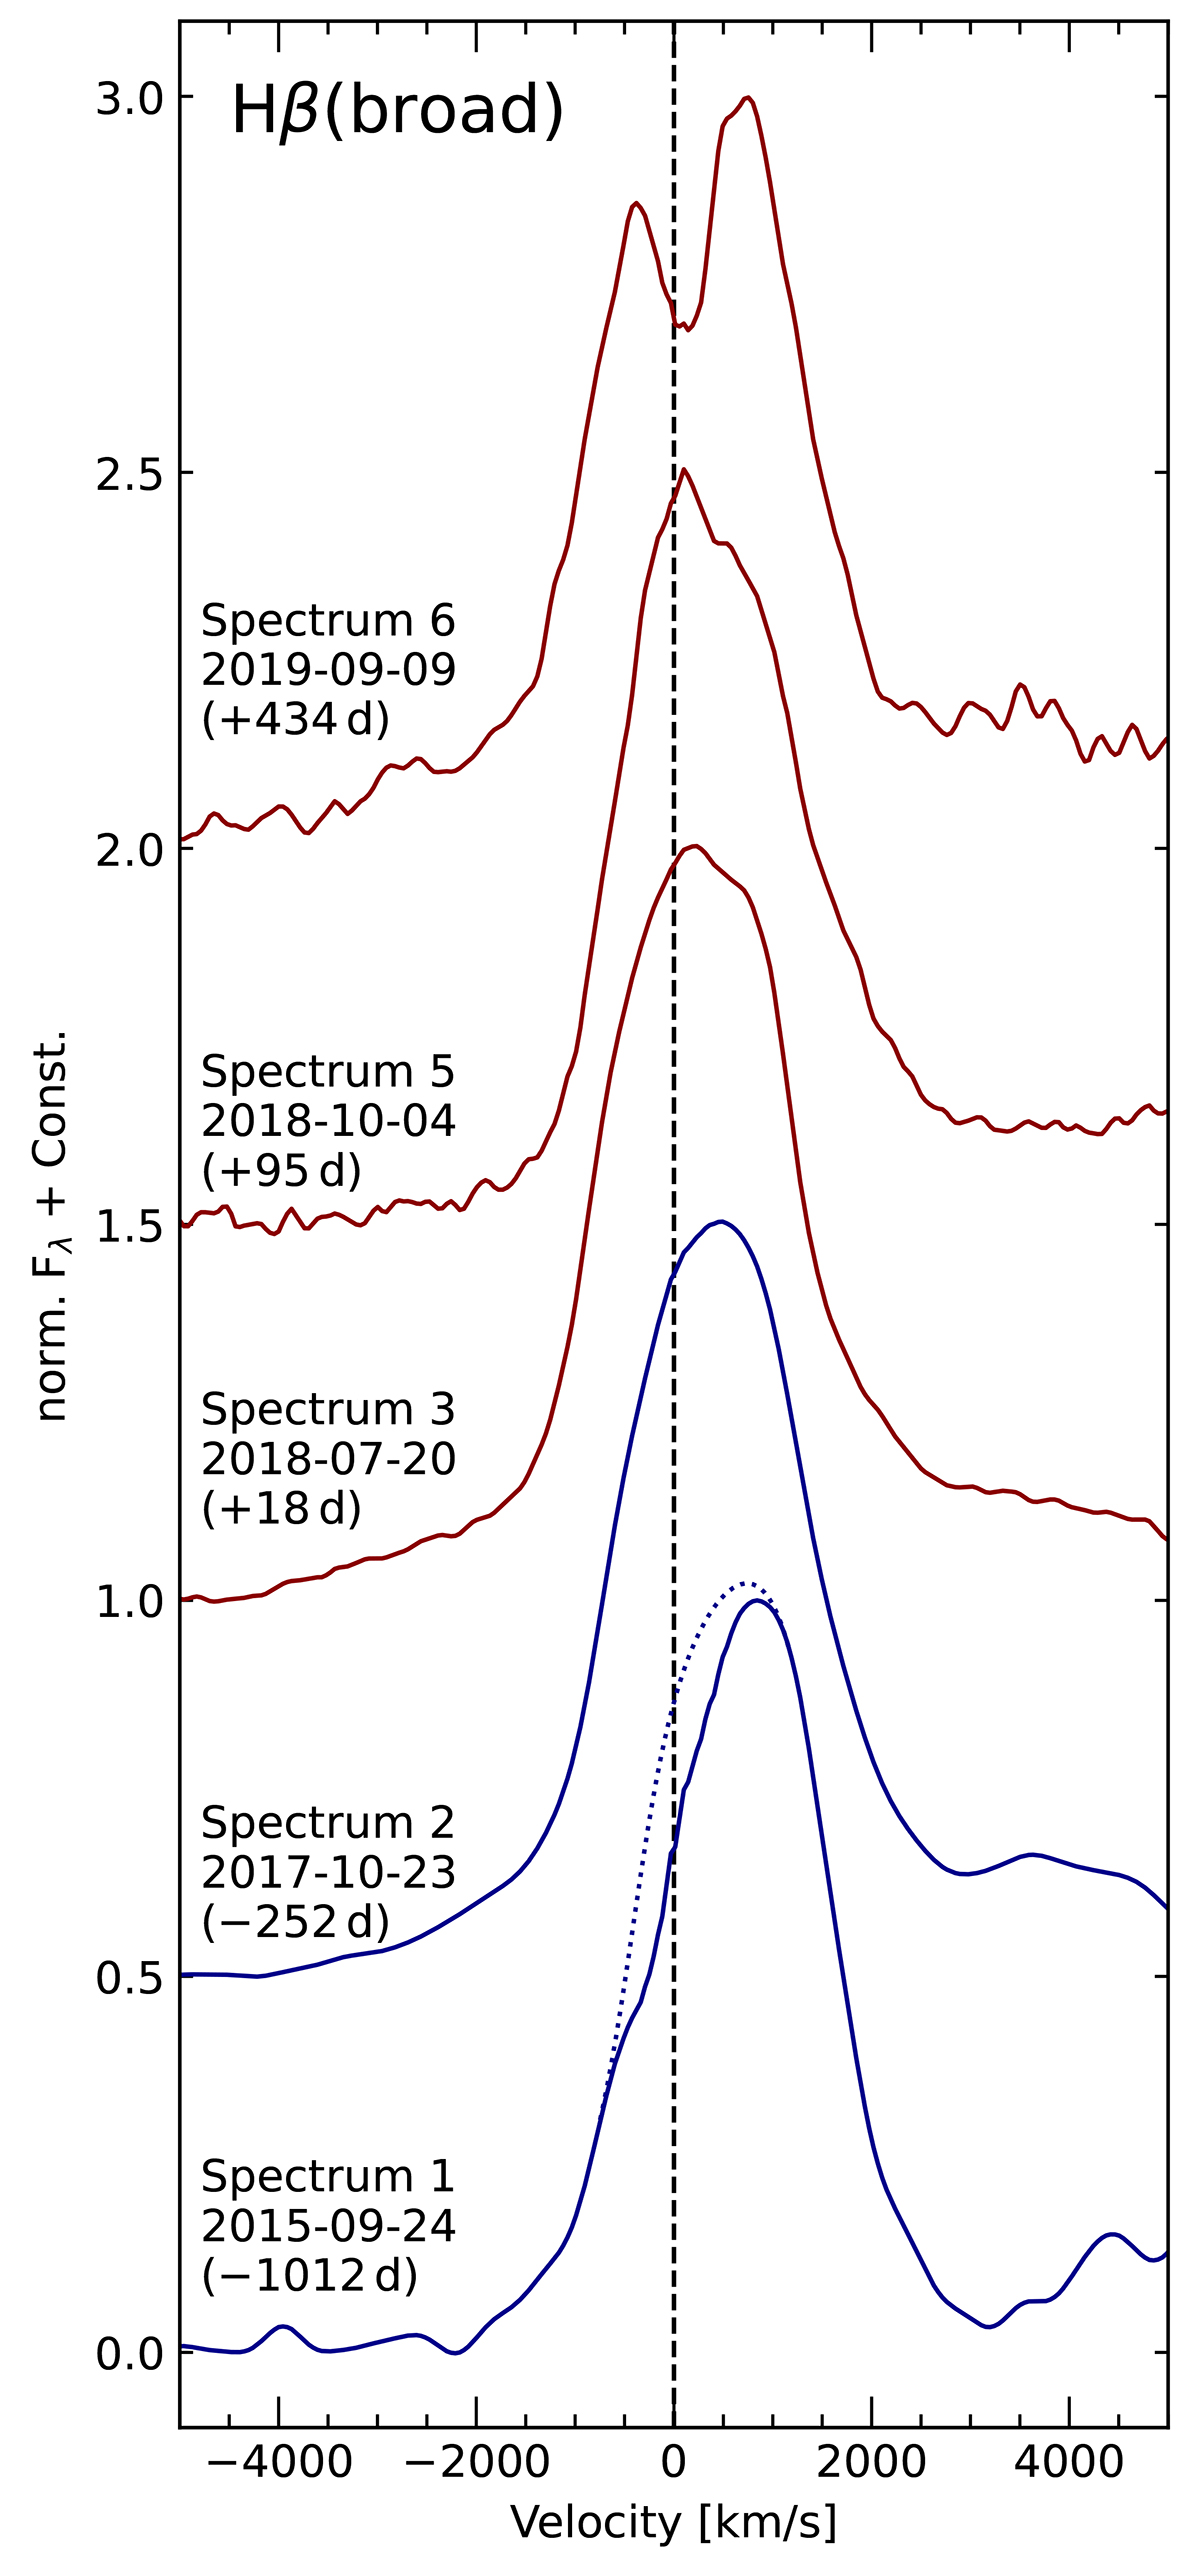
Temporal evolution (from bottom to top) of the normalized, narrow-line, and host-galaxy-subtracted Hβ profiles in velocity space. A suitable linear pseudo-continuum was subtracted, and the spectra are flux-shifted for clarity. MUSE spectra are shown in blue, SALT spectra are shown in red. The central velocity v = 0 km s−1 is indicated by a dashed line. We give the spectrum ID, the date of observations, and the time in days with respect to the peak time t0 = 58301.44 MJD of the transient event. The reconstructed Hβ profile for Spectrum 1 (2015 September 24) is shown as a dotted line (see Sect. 3.3).
Current usage metrics show cumulative count of Article Views (full-text article views including HTML views, PDF and ePub downloads, according to the available data) and Abstracts Views on Vision4Press platform.
Data correspond to usage on the plateform after 2015. The current usage metrics is available 48-96 hours after online publication and is updated daily on week days.
Initial download of the metrics may take a while.