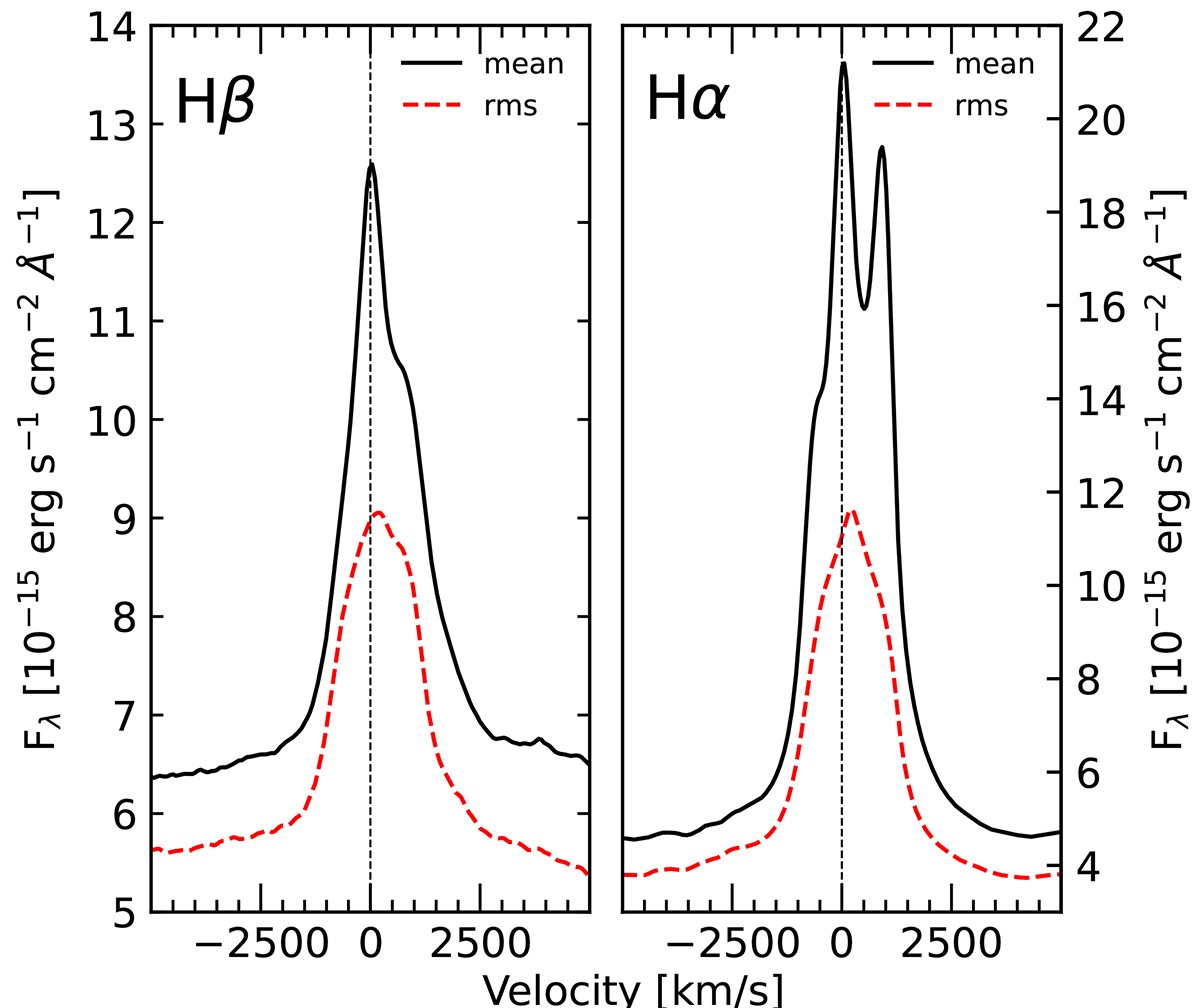
Fig. 6.
Download original image
Mean (solid black) and rms (dashed red) line profiles of Hβ (left panel) and Hα (right panel). The central velocity v = 0 km s−1 is indicated by a black dashed line. The Hβ and Hα rms profiles show a peak at +(220 ± 50) km s−1 and +(210 ± 50) km s−1, respectively, with respect to the central wavelength. The profiles are strongly asymmetric with the red wing being broader by about ∼400 km s−1. The FWHM amounts to (2180 ± 50) km s−1 and (2060 ± 50) km s−1 for Hβ and Hα, respectively.
Current usage metrics show cumulative count of Article Views (full-text article views including HTML views, PDF and ePub downloads, according to the available data) and Abstracts Views on Vision4Press platform.
Data correspond to usage on the plateform after 2015. The current usage metrics is available 48-96 hours after online publication and is updated daily on week days.
Initial download of the metrics may take a while.