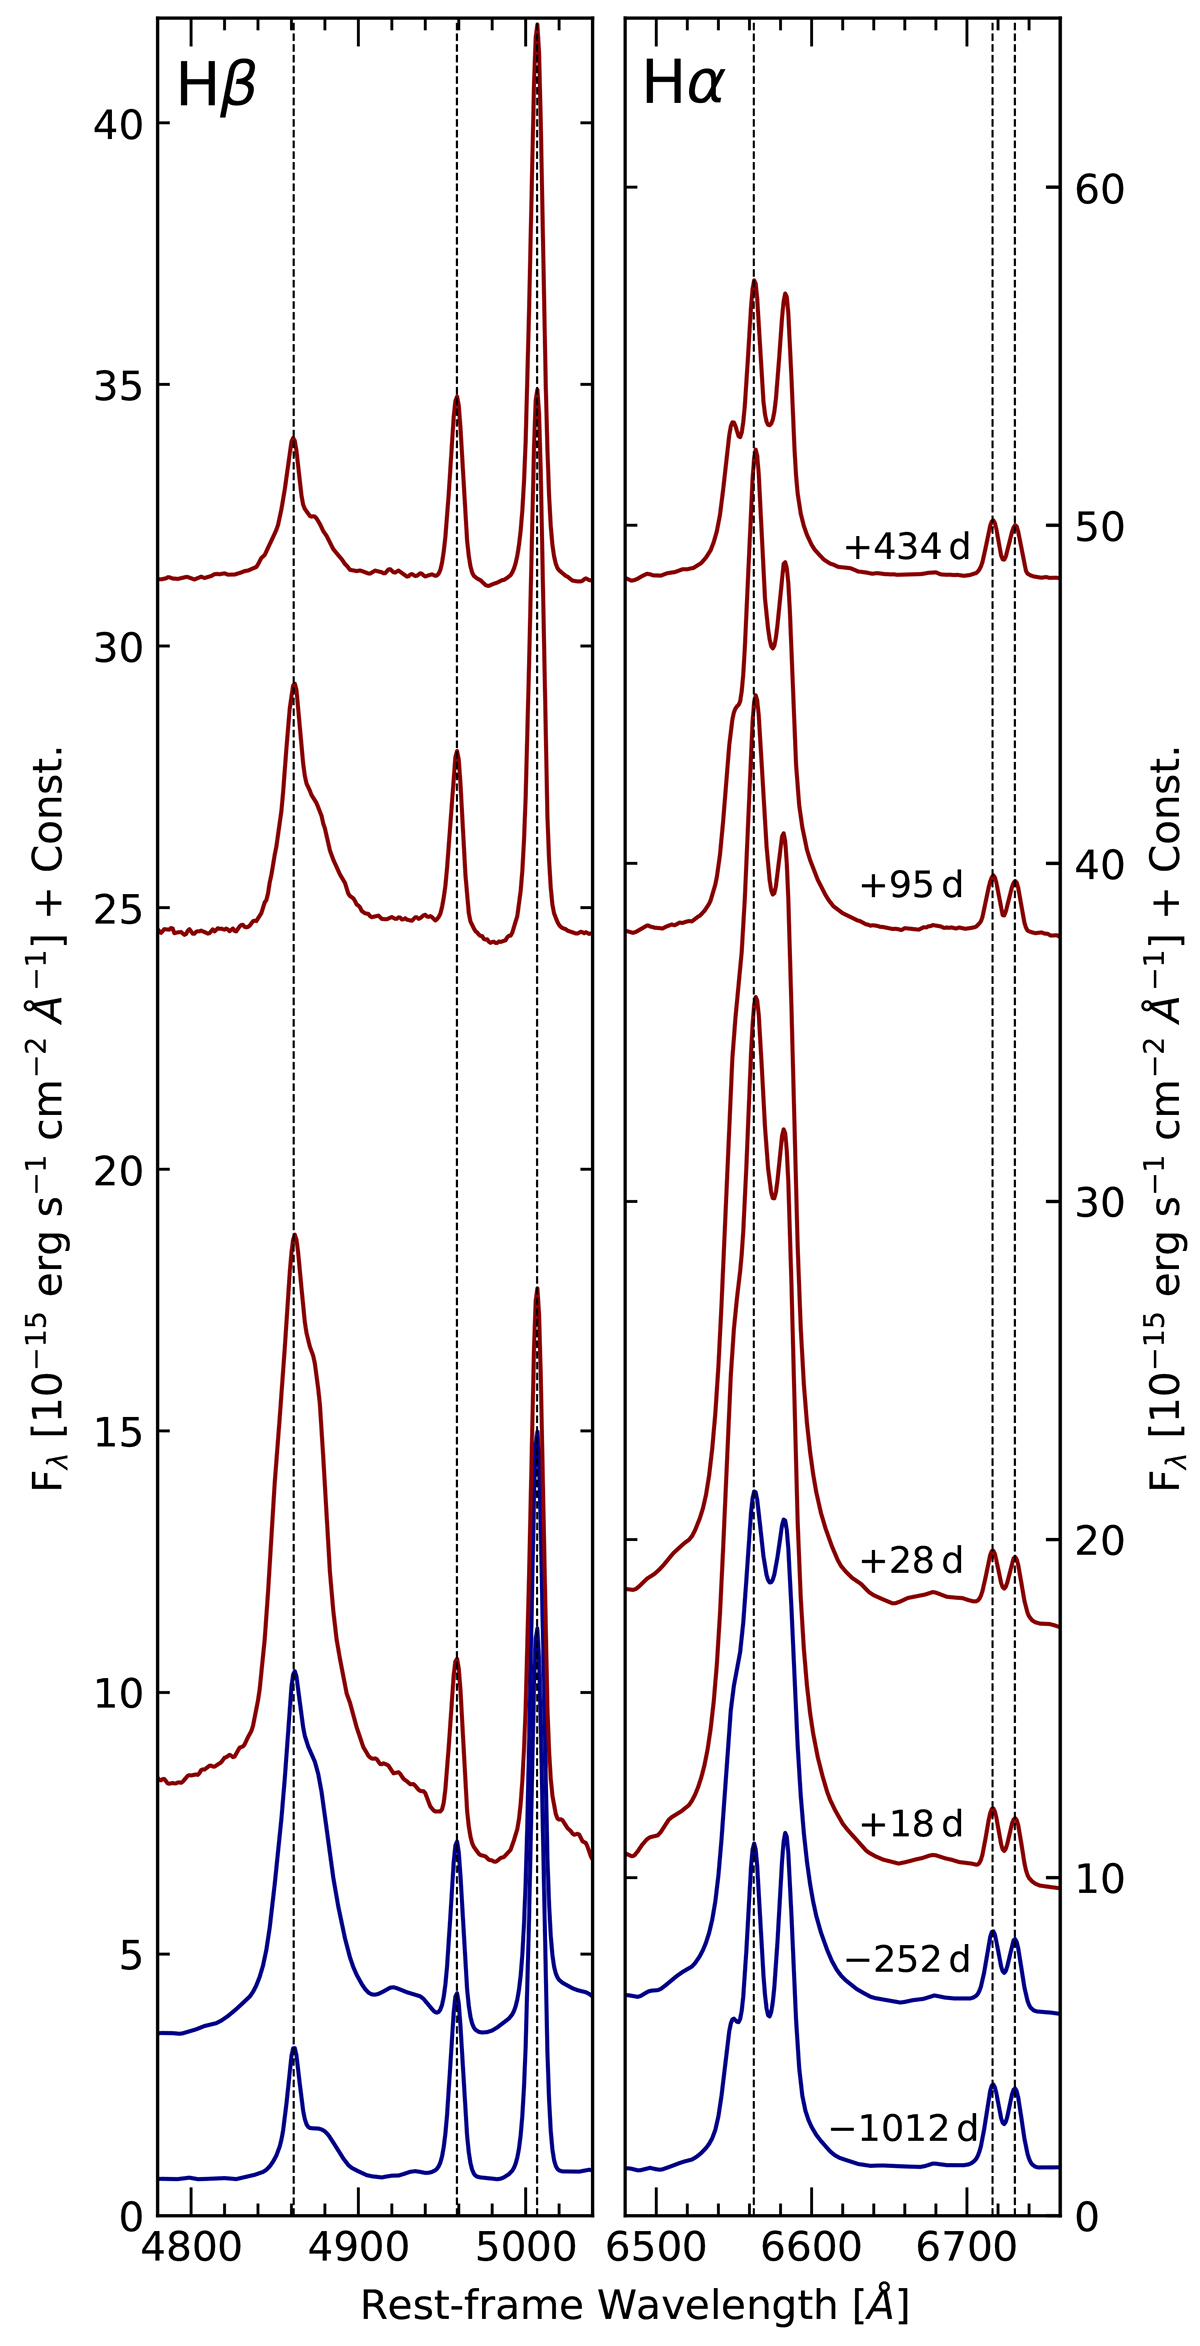
Fig. 5.
Download original image
Temporal evolution (from bottom to top) of the host-free line profiles of Hβ (left panel) and Hα (right panel). MUSE spectra are shown in blue, SALT spectra are shown in red. The profiles are shifted in flux for clarity. We indicate the central wavelengths of Hβ and Hα by dashed lines. Likewise, we indicate the central wavelengths of the narrow lines [O III] λ4959, 5007 and [S II] λλ6716, 6731 to demonstrate the accuracy of the spectral calibration.
Current usage metrics show cumulative count of Article Views (full-text article views including HTML views, PDF and ePub downloads, according to the available data) and Abstracts Views on Vision4Press platform.
Data correspond to usage on the plateform after 2015. The current usage metrics is available 48-96 hours after online publication and is updated daily on week days.
Initial download of the metrics may take a while.