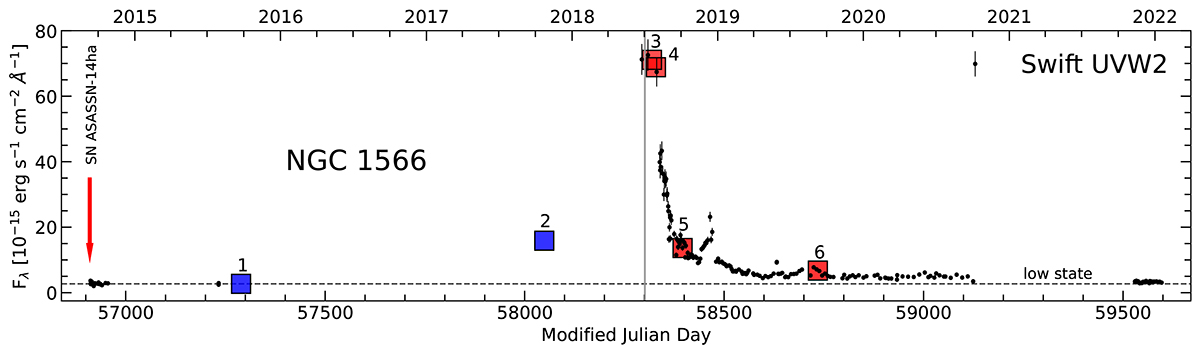
Fig. 3.
Download original image
Long-term UV Swift UVW2-band light curve before, during, and after the transient event in NGC 1566 from 2017 to 2019. The blue and red boxes mark the time stamps of the spectroscopic MUSE and SALT observations, respectively, and are numbered chronologically. To guide the eye, the boxes are positioned such that they overlap with the UVW2 light curve; that is to say, they do not represent the actual optical flux values, but give a basic representation of the relative flux with respect to each other. The date of detection of the supernova ASASSN-14ha is indicated by a red arrow and the date of peak flux in the ASAS-SN light curve is shown by a gray line. The pretransient low-state flux level is indicated by a dashed black line.
Current usage metrics show cumulative count of Article Views (full-text article views including HTML views, PDF and ePub downloads, according to the available data) and Abstracts Views on Vision4Press platform.
Data correspond to usage on the plateform after 2015. The current usage metrics is available 48-96 hours after online publication and is updated daily on week days.
Initial download of the metrics may take a while.