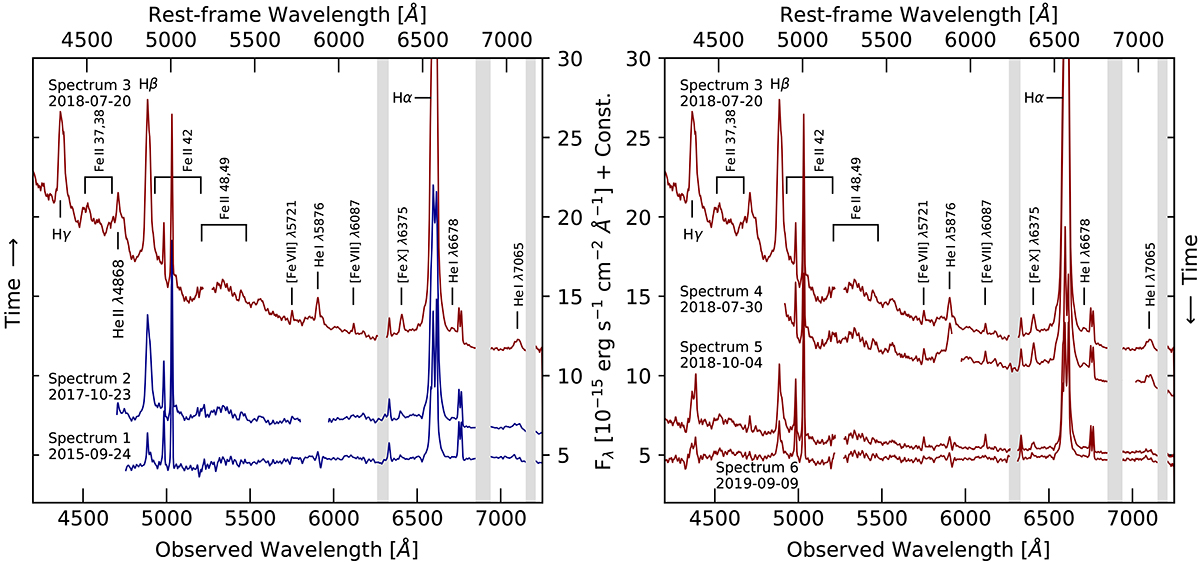
Fig. 2.
Download original image
All optical spectra obtained before, during, and after the transient event in NGC 1566. MUSE and SALT spectra are shown in blue and red, respectively. The left panel shows the spectra obtained during the rising phase, including the optical spectrum from 2018 July 20, while the right panel shows the spectra obtained during the declining phase, again including the optical high-state spectrum from 2018 July 20 for reference. The SALT spectrum from 2018 July 30 is shifted by −2 × 10⁻¹⁵ ergs s−1 cm−2 Å−1 for clarity. For each spectrum, we give the ID as well as the UT date of the observation. The most prominent telluric absorption bands are flagged (gray).
Current usage metrics show cumulative count of Article Views (full-text article views including HTML views, PDF and ePub downloads, according to the available data) and Abstracts Views on Vision4Press platform.
Data correspond to usage on the plateform after 2015. The current usage metrics is available 48-96 hours after online publication and is updated daily on week days.
Initial download of the metrics may take a while.