Fig. 14.
Download original image
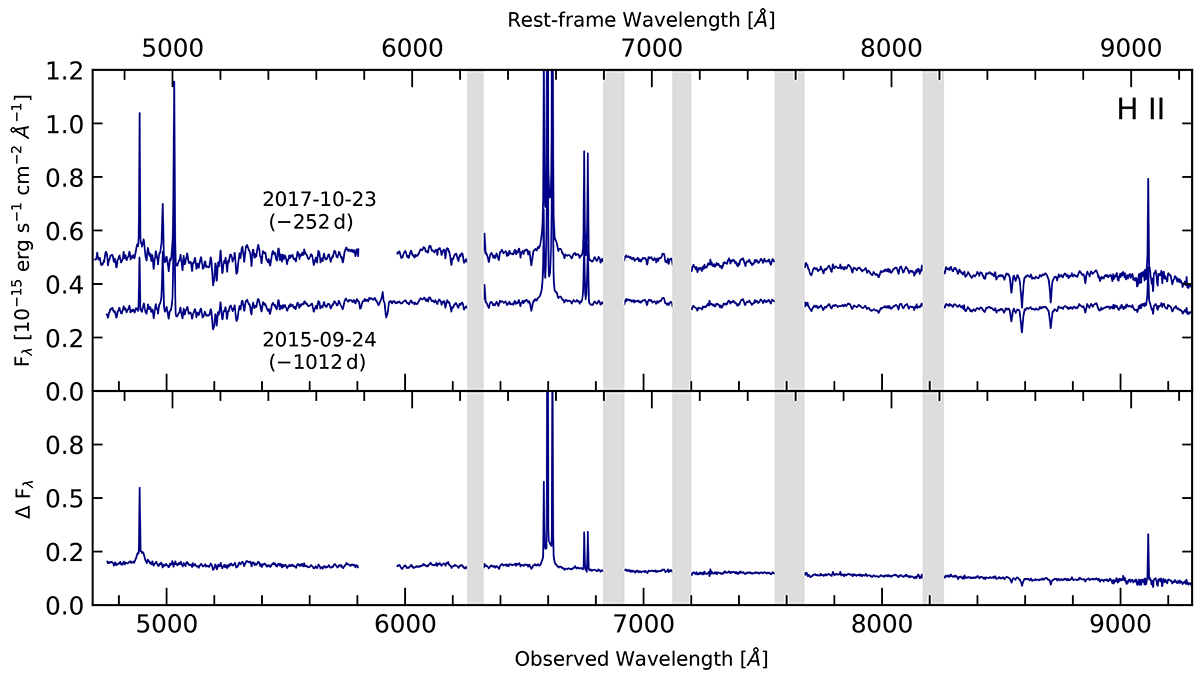
Spectrum of the H II region at a distance of ![]() from the nucleus taken on 2015 September 24 and 2017 October 23, respectively, intercalibrated to the same [O III] λ5007 flux of (4.2 ± 0.3)×10−15 ergs s−1 cm−2 (upper panel) and the resulting difference spectrum (lower panel). Spectral regions strongly influenced by telluric absorption are shown in gray. The apparent continuum flux increase on 2017 October 23 is caused by scattered radiation from the brightening nucleus.
from the nucleus taken on 2015 September 24 and 2017 October 23, respectively, intercalibrated to the same [O III] λ5007 flux of (4.2 ± 0.3)×10−15 ergs s−1 cm−2 (upper panel) and the resulting difference spectrum (lower panel). Spectral regions strongly influenced by telluric absorption are shown in gray. The apparent continuum flux increase on 2017 October 23 is caused by scattered radiation from the brightening nucleus.
Current usage metrics show cumulative count of Article Views (full-text article views including HTML views, PDF and ePub downloads, according to the available data) and Abstracts Views on Vision4Press platform.
Data correspond to usage on the plateform after 2015. The current usage metrics is available 48-96 hours after online publication and is updated daily on week days.
Initial download of the metrics may take a while.