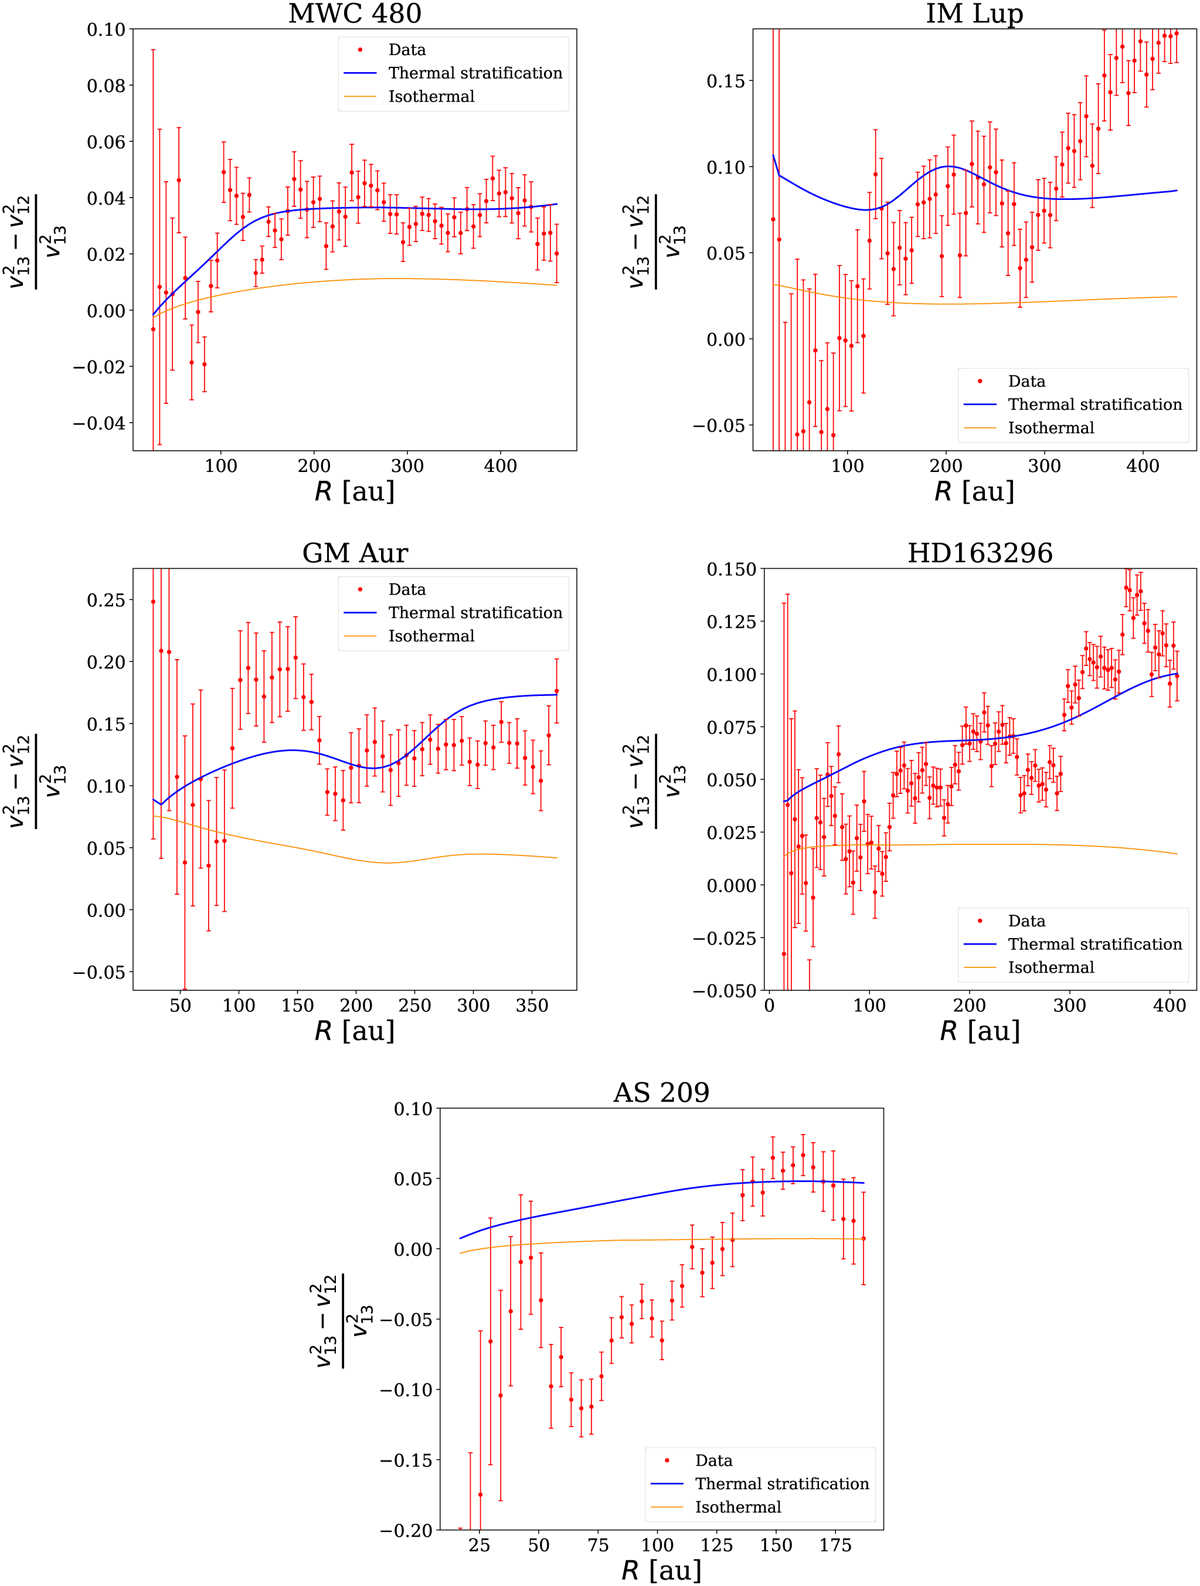
Fig. 8
Download original image
Relative difference between the squares of observed 12CO and 13CO rotation curves predicted by the thermally stratified model (blue line), the isothermal model (orange line), and the data (red dots). Except for AS 209, where this quantity is negative in the inner part, it is clearly visible that data are well reproduced by the stratified model. Indeed, the difference of speed between the two curves cannot be explained just in terms of different height.
Current usage metrics show cumulative count of Article Views (full-text article views including HTML views, PDF and ePub downloads, according to the available data) and Abstracts Views on Vision4Press platform.
Data correspond to usage on the plateform after 2015. The current usage metrics is available 48-96 hours after online publication and is updated daily on week days.
Initial download of the metrics may take a while.