Open Access
Fig. 3
Download original image
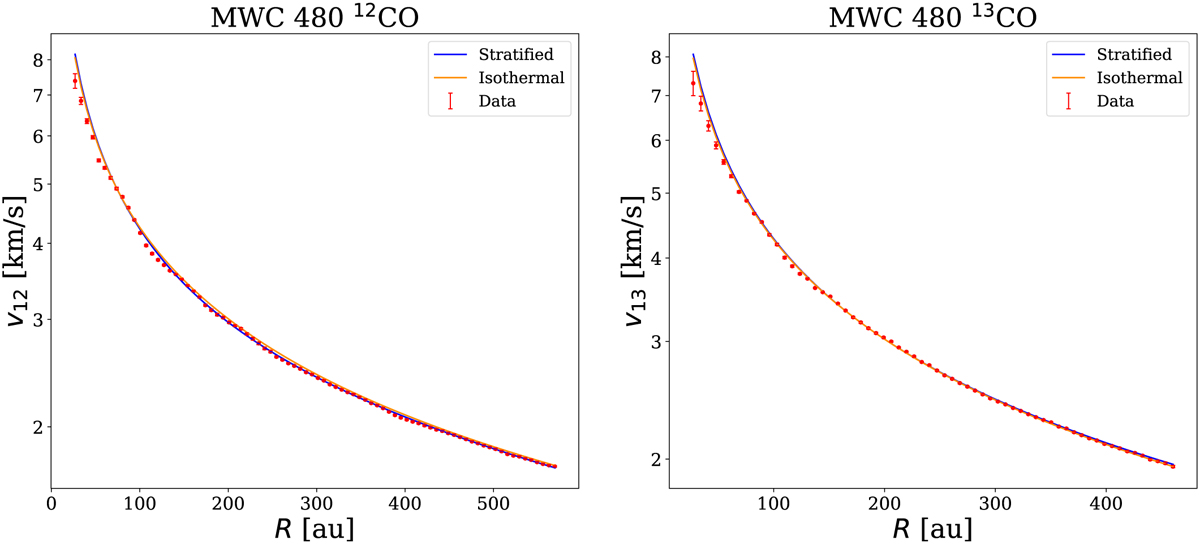
Rotation curves of MWC 480 obtained from CO isotopologues. Left panel: Rotation curve obtained from 12CO data (red points), along with our best-fitting curve for the stratified model (blue line) and the isothermal one (orange line). Right panel: same for the 13CO data.
Current usage metrics show cumulative count of Article Views (full-text article views including HTML views, PDF and ePub downloads, according to the available data) and Abstracts Views on Vision4Press platform.
Data correspond to usage on the plateform after 2015. The current usage metrics is available 48-96 hours after online publication and is updated daily on week days.
Initial download of the metrics may take a while.