Fig. 1
Download original image
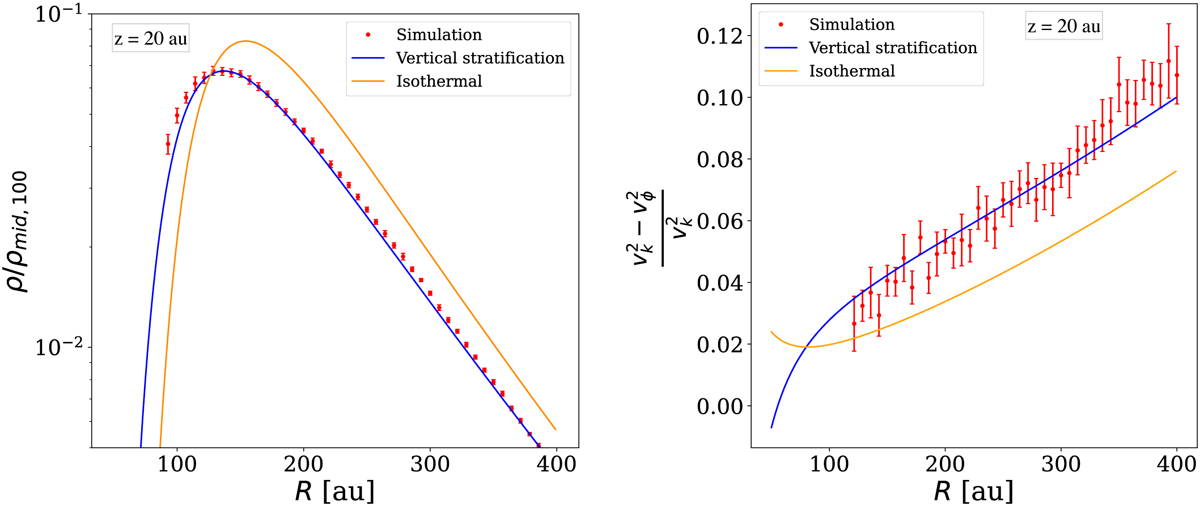
Comparison between the analytical models and the simulation after eight outer orbits and at z = 20 au. Left panel: density field. Right panel: Pressure gradient term of the rotation curve. The red dots represent the simulation data, while the blue and orange line show the thermally stratified model and the isothermal one, respectively. The model with thermal stratification matches very well the simulation.
Current usage metrics show cumulative count of Article Views (full-text article views including HTML views, PDF and ePub downloads, according to the available data) and Abstracts Views on Vision4Press platform.
Data correspond to usage on the plateform after 2015. The current usage metrics is available 48-96 hours after online publication and is updated daily on week days.
Initial download of the metrics may take a while.