Open Access
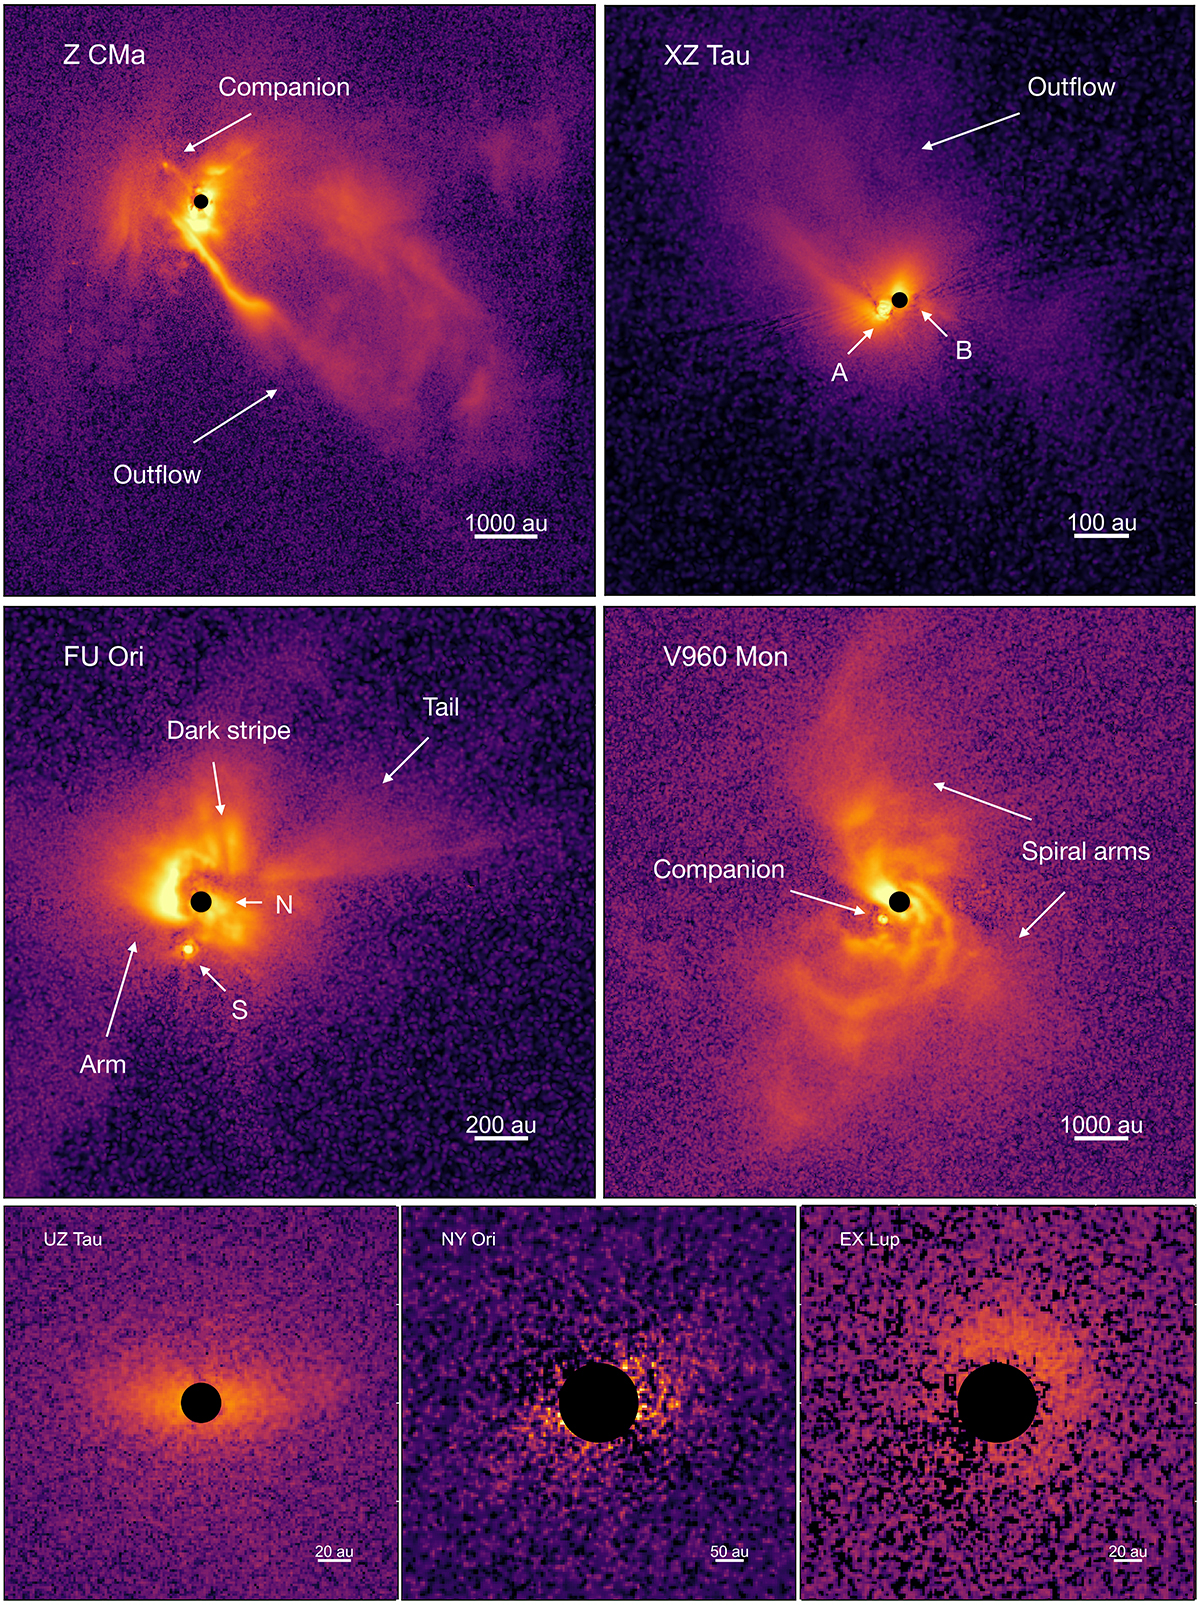
Fig. 1.
Download original image
Gallery of all the SPHERE polarized light images of the eruptive stars in the H band. North is up, and east is to the left. The black circle indicates the region masked by the coronagraph. The color scale was optimized for a better visualization; in Fig. A.1 a color bar indicates the values of the surface brightness.
Current usage metrics show cumulative count of Article Views (full-text article views including HTML views, PDF and ePub downloads, according to the available data) and Abstracts Views on Vision4Press platform.
Data correspond to usage on the plateform after 2015. The current usage metrics is available 48-96 hours after online publication and is updated daily on week days.
Initial download of the metrics may take a while.