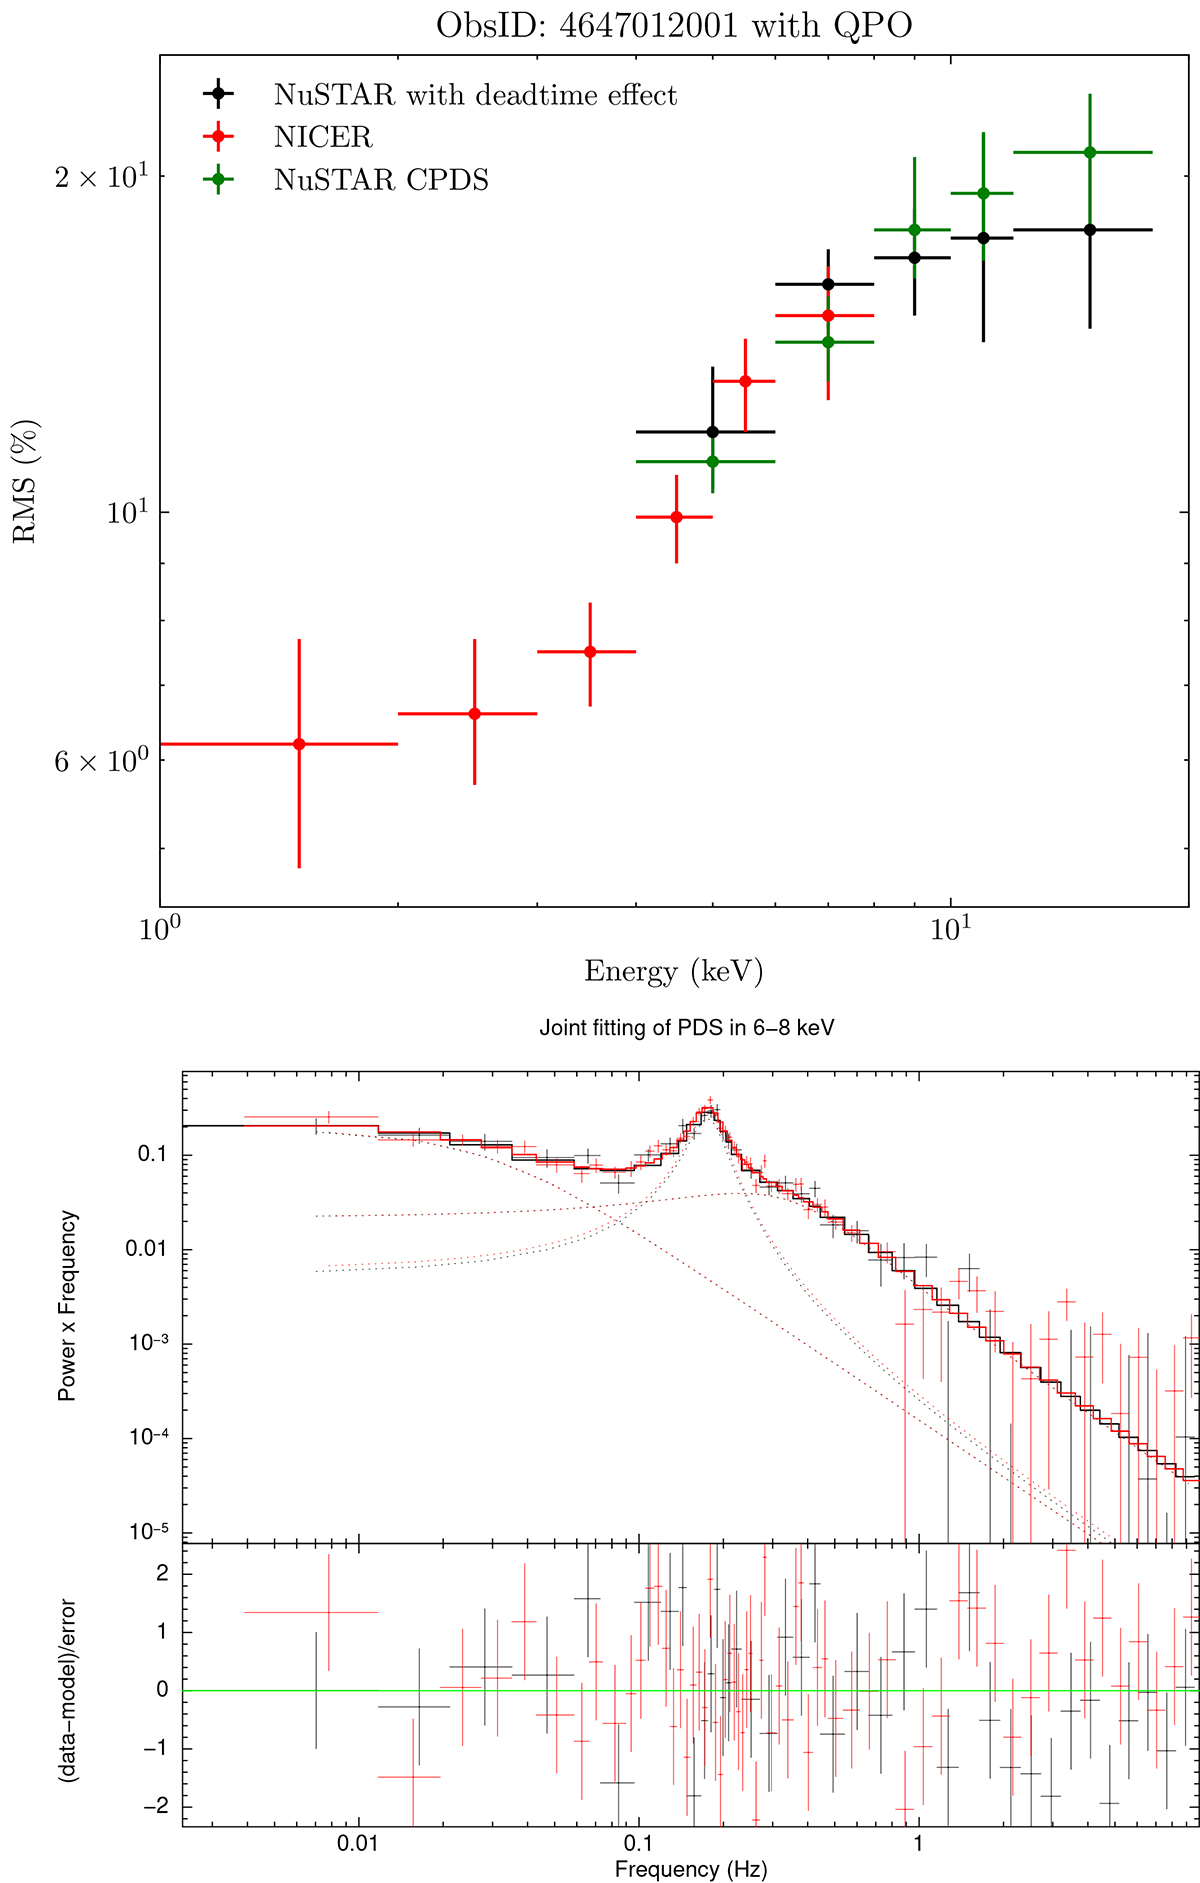
Fig. 7.
Download original image
Upper panel: evolution of the RMS with energy. The data points in red and black correspond to simultaneous observations conducted by NICER and NuSTAR on July 14, 2021 (NICER: 4647012001; NuSTAR: 90701323002). The green points show the RMS spectrum of NuSTAR from cross-power density spectra (CPDS). Bottom panel: joint fitting of the PDS in 6 − 8 keV. The black and red points show the PDS of NICER and CPDS of NuSTAR, separately.
Current usage metrics show cumulative count of Article Views (full-text article views including HTML views, PDF and ePub downloads, according to the available data) and Abstracts Views on Vision4Press platform.
Data correspond to usage on the plateform after 2015. The current usage metrics is available 48-96 hours after online publication and is updated daily on week days.
Initial download of the metrics may take a while.