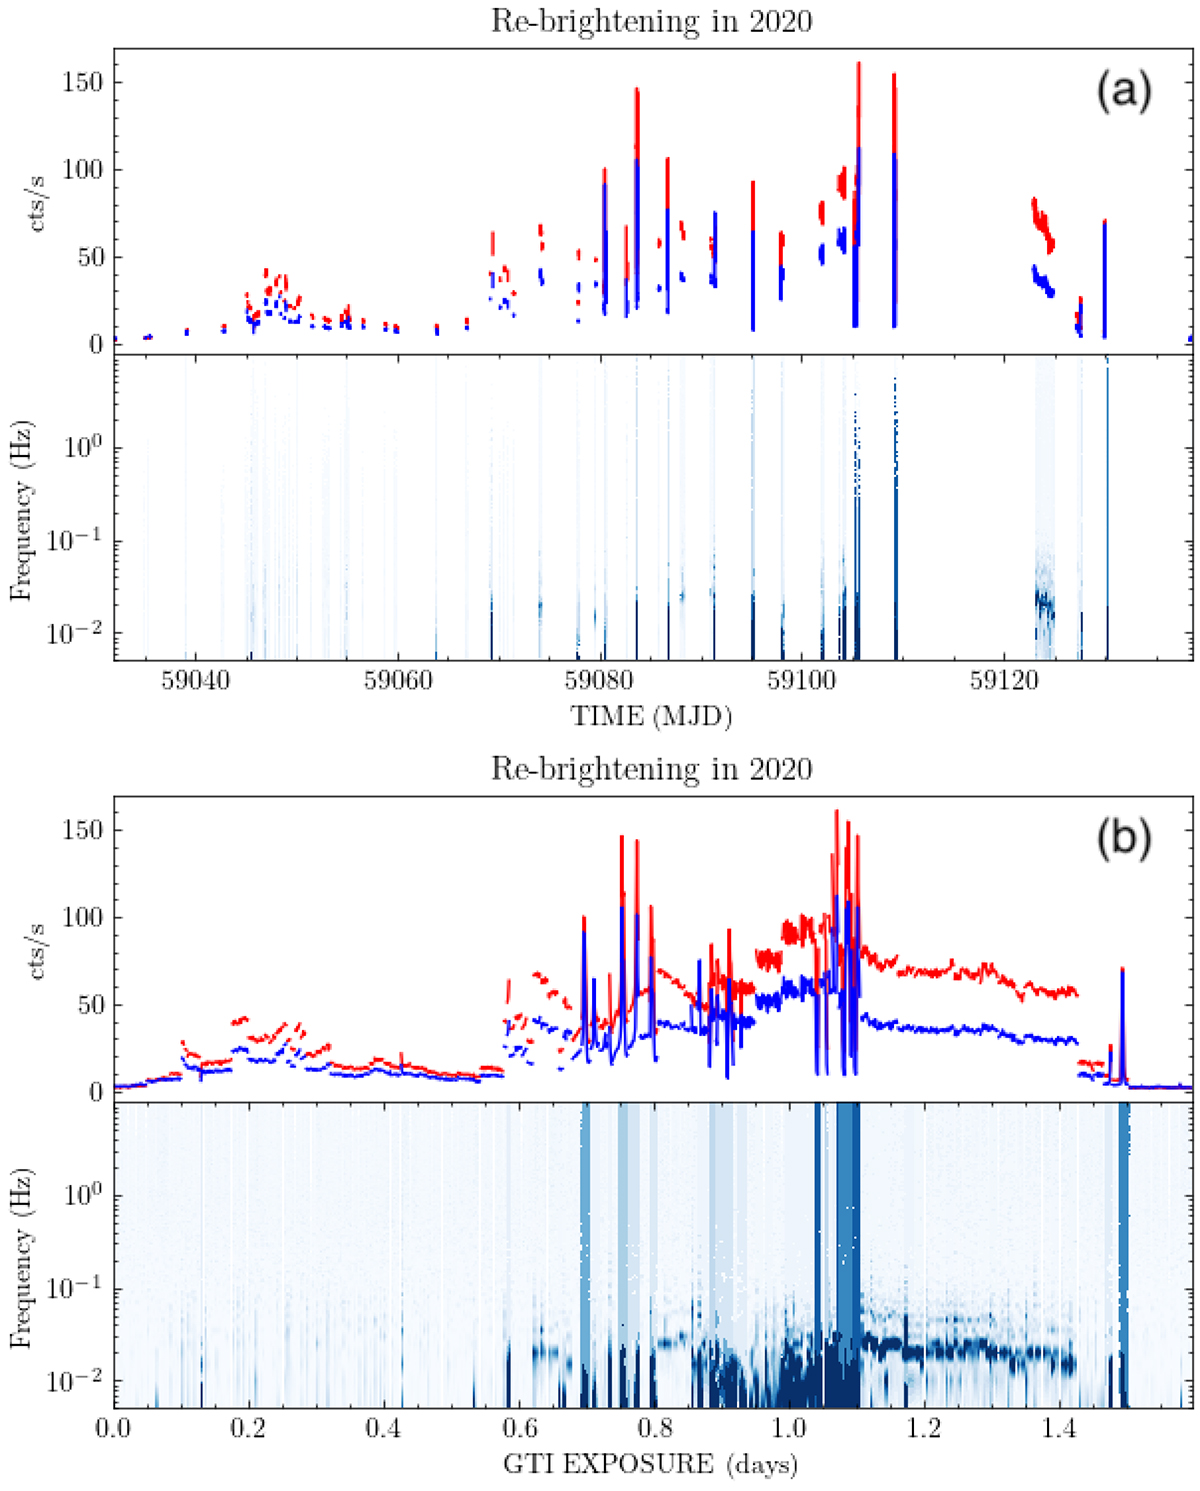
Fig. 2.
Download original image
Panel a: (top) rebrightening in 2020 in the 1 − 4 keV and 4 − 10 keV, represented by red and blue curves, respectively. (bottom) Dynamic power density spectrum (PDS) spanning the 1 − 10 keV range. Panel b: (top) the gaps between effective observations were eliminated, due to the extended timescale of the data, to enhance the clarity of the temporal evolution. The figure clearly reveals the presence of mHz QPOs ∼20 mHz, a pattern that aligns with the heartbeat state.
Current usage metrics show cumulative count of Article Views (full-text article views including HTML views, PDF and ePub downloads, according to the available data) and Abstracts Views on Vision4Press platform.
Data correspond to usage on the plateform after 2015. The current usage metrics is available 48-96 hours after online publication and is updated daily on week days.
Initial download of the metrics may take a while.