Open Access
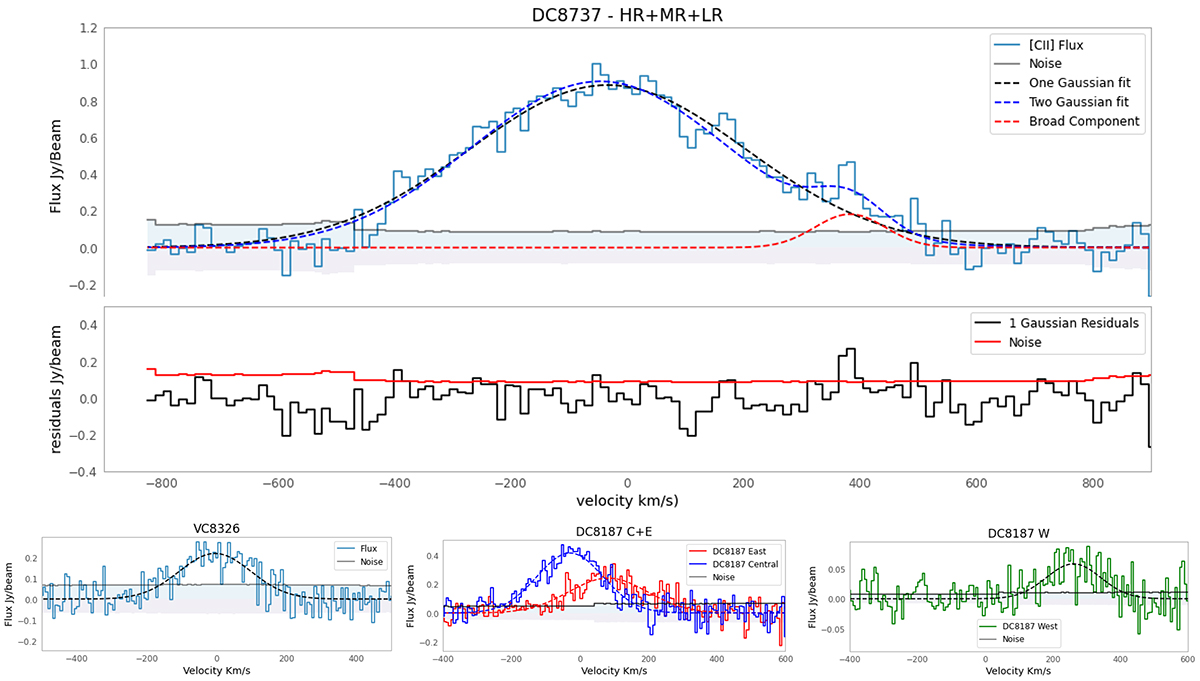
Fig. 5.
Download original image
Spectra of [CII]. Top panel shows the spectrum for DC8737 along with the residuals (middle panel) when the Gaussian fit is subtracted from the data. The bottom three panels show from left to right: the spectra for VC8327, DC8187 (central and east galaxies), and, finally, DC8737 (west galaxy).
Current usage metrics show cumulative count of Article Views (full-text article views including HTML views, PDF and ePub downloads, according to the available data) and Abstracts Views on Vision4Press platform.
Data correspond to usage on the plateform after 2015. The current usage metrics is available 48-96 hours after online publication and is updated daily on week days.
Initial download of the metrics may take a while.