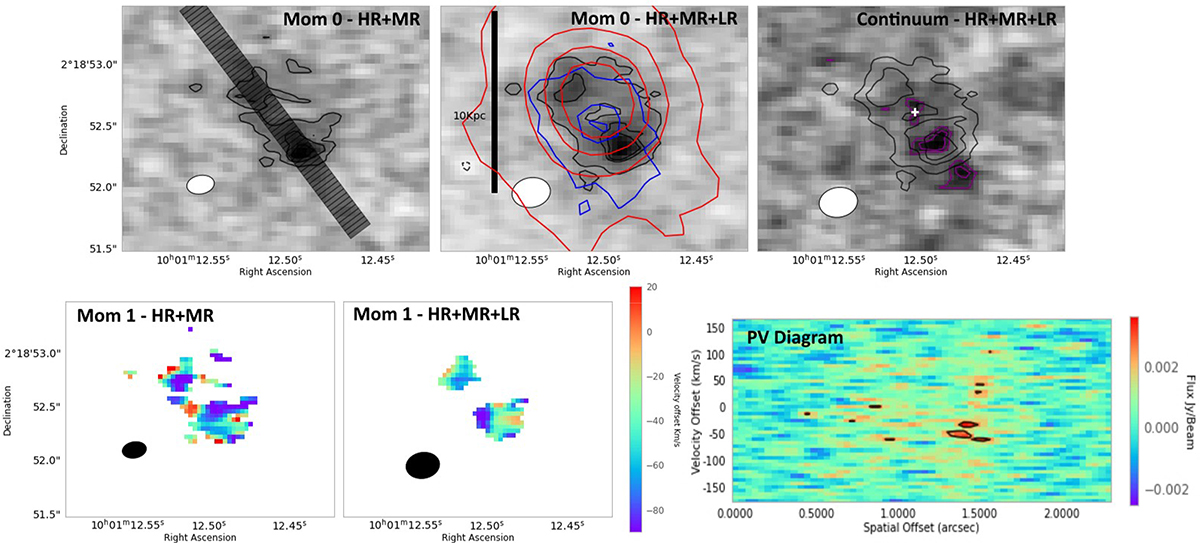
Fig. 2.
Download original image
Summary of maps produced for VC8326. Top line shows the moment 0 maps of VC8326, from left to right: HR+MR (with contours from ±3, 4, 5, …σ) and HR+MR+MR – with contours from ±3, 4, 5, …σ, along with HST/ACS F814W (Koekemoer et al. 2007; blue; 3, 5, 7, 9σ) and a K-band (red; 3, 13, 23, 33σ) continuum map (with continuum and [CII] contours from 3σ in purple and black, respectively). The second line shows PV diagram (from the slit shown on the top line taken in the HR+MR concatenation) with contours of 0.7, 0.8, and 0.9 times the peak value) and the moment 1 maps which are cut to 3 and 5σ, respectively.
Current usage metrics show cumulative count of Article Views (full-text article views including HTML views, PDF and ePub downloads, according to the available data) and Abstracts Views on Vision4Press platform.
Data correspond to usage on the plateform after 2015. The current usage metrics is available 48-96 hours after online publication and is updated daily on week days.
Initial download of the metrics may take a while.