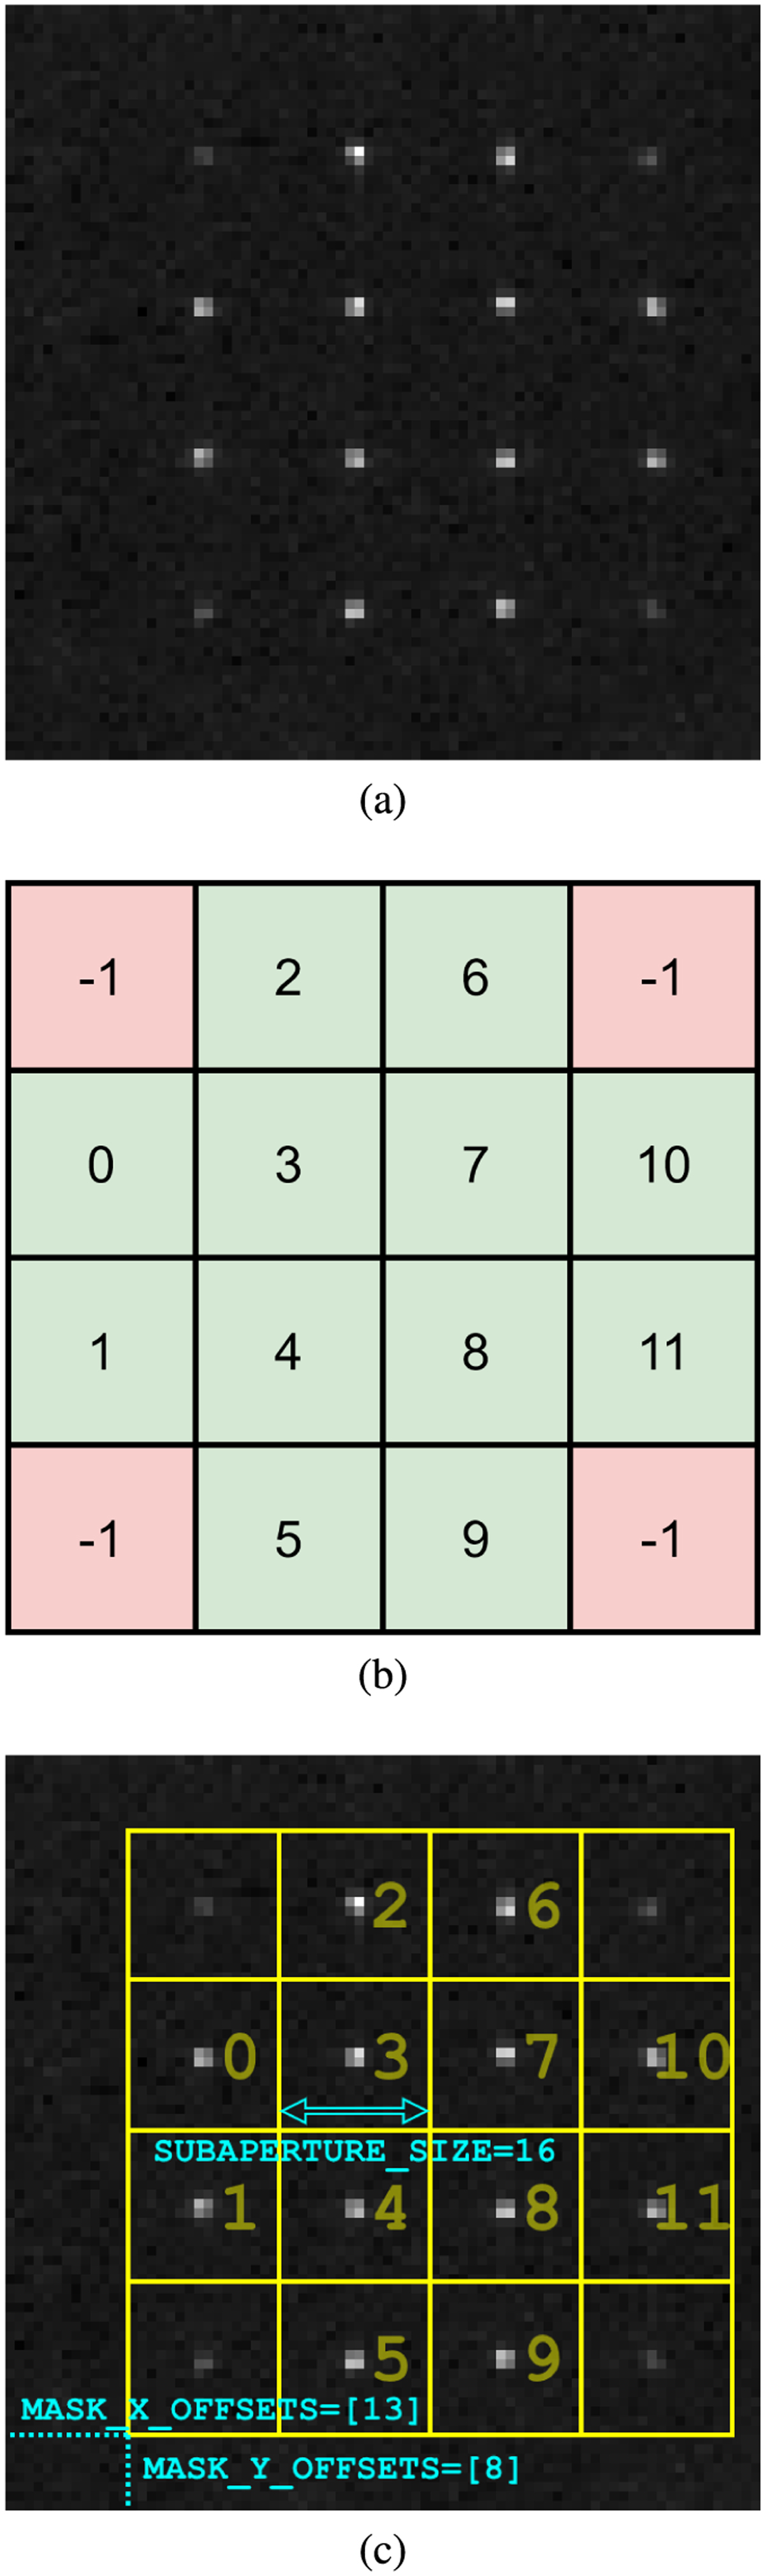
Fig. 2
Download original image
Diagram showing how the relationship between wave-front sensor subapertures and detector pixels can be deduced from SUBAPERTURE_MASK, MASK_X_OFFSETS, MASK_Y_OFFSETS and SUBAPERTURE_SIZE. Panel a: example 80 × 80 PIXEL_INTENSITIES image from the wavefront sensor’s detector. Panel b: example 4 × 4 SUBAPERTURE_MASK for a wavefront sensor with 12 valid subapertures. Cells with value −1 indicate an invalid subaperture, while the others indicate the index of that subaperture in the sensor data.. Panel c: SUBAPERTURE_MASK superimposed over PIXEL_INTENSITIES. In this case, MASK_X_OFFSETS and MASK_Y_OFFSETS have length one, indicating that the mask is superimposed once, and its lowermost positions in X and Y are 13 and 8, respectively. SUBAPERTURE_SIZE defines each subaperture as corresponding to 16 pixels.
Current usage metrics show cumulative count of Article Views (full-text article views including HTML views, PDF and ePub downloads, according to the available data) and Abstracts Views on Vision4Press platform.
Data correspond to usage on the plateform after 2015. The current usage metrics is available 48-96 hours after online publication and is updated daily on week days.
Initial download of the metrics may take a while.