Fig. 3.
Download original image
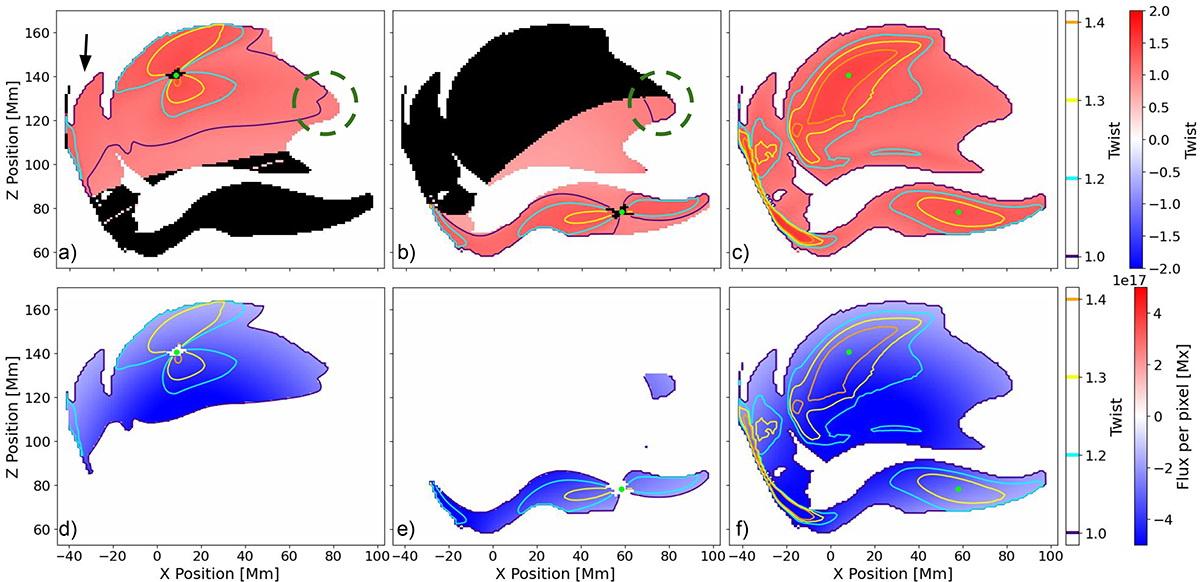
Output for the Tw ≥ 1.0 mask. The first row shows Tg for the upper and lower FRs (a, b), and Tw (c) with isocontours and colour maps of their respective twist metrics. The second row shows the signed flux for the upper and lower FRs (d, e), and for the Tw region (f) with the same isocontours as the first row and colour maps of signed flux. The green dashed-circles highlight overlapping regions and the black arrow indicates a particular feature, both described in Sect. 3.1.
Current usage metrics show cumulative count of Article Views (full-text article views including HTML views, PDF and ePub downloads, according to the available data) and Abstracts Views on Vision4Press platform.
Data correspond to usage on the plateform after 2015. The current usage metrics is available 48-96 hours after online publication and is updated daily on week days.
Initial download of the metrics may take a while.