Fig. 2.
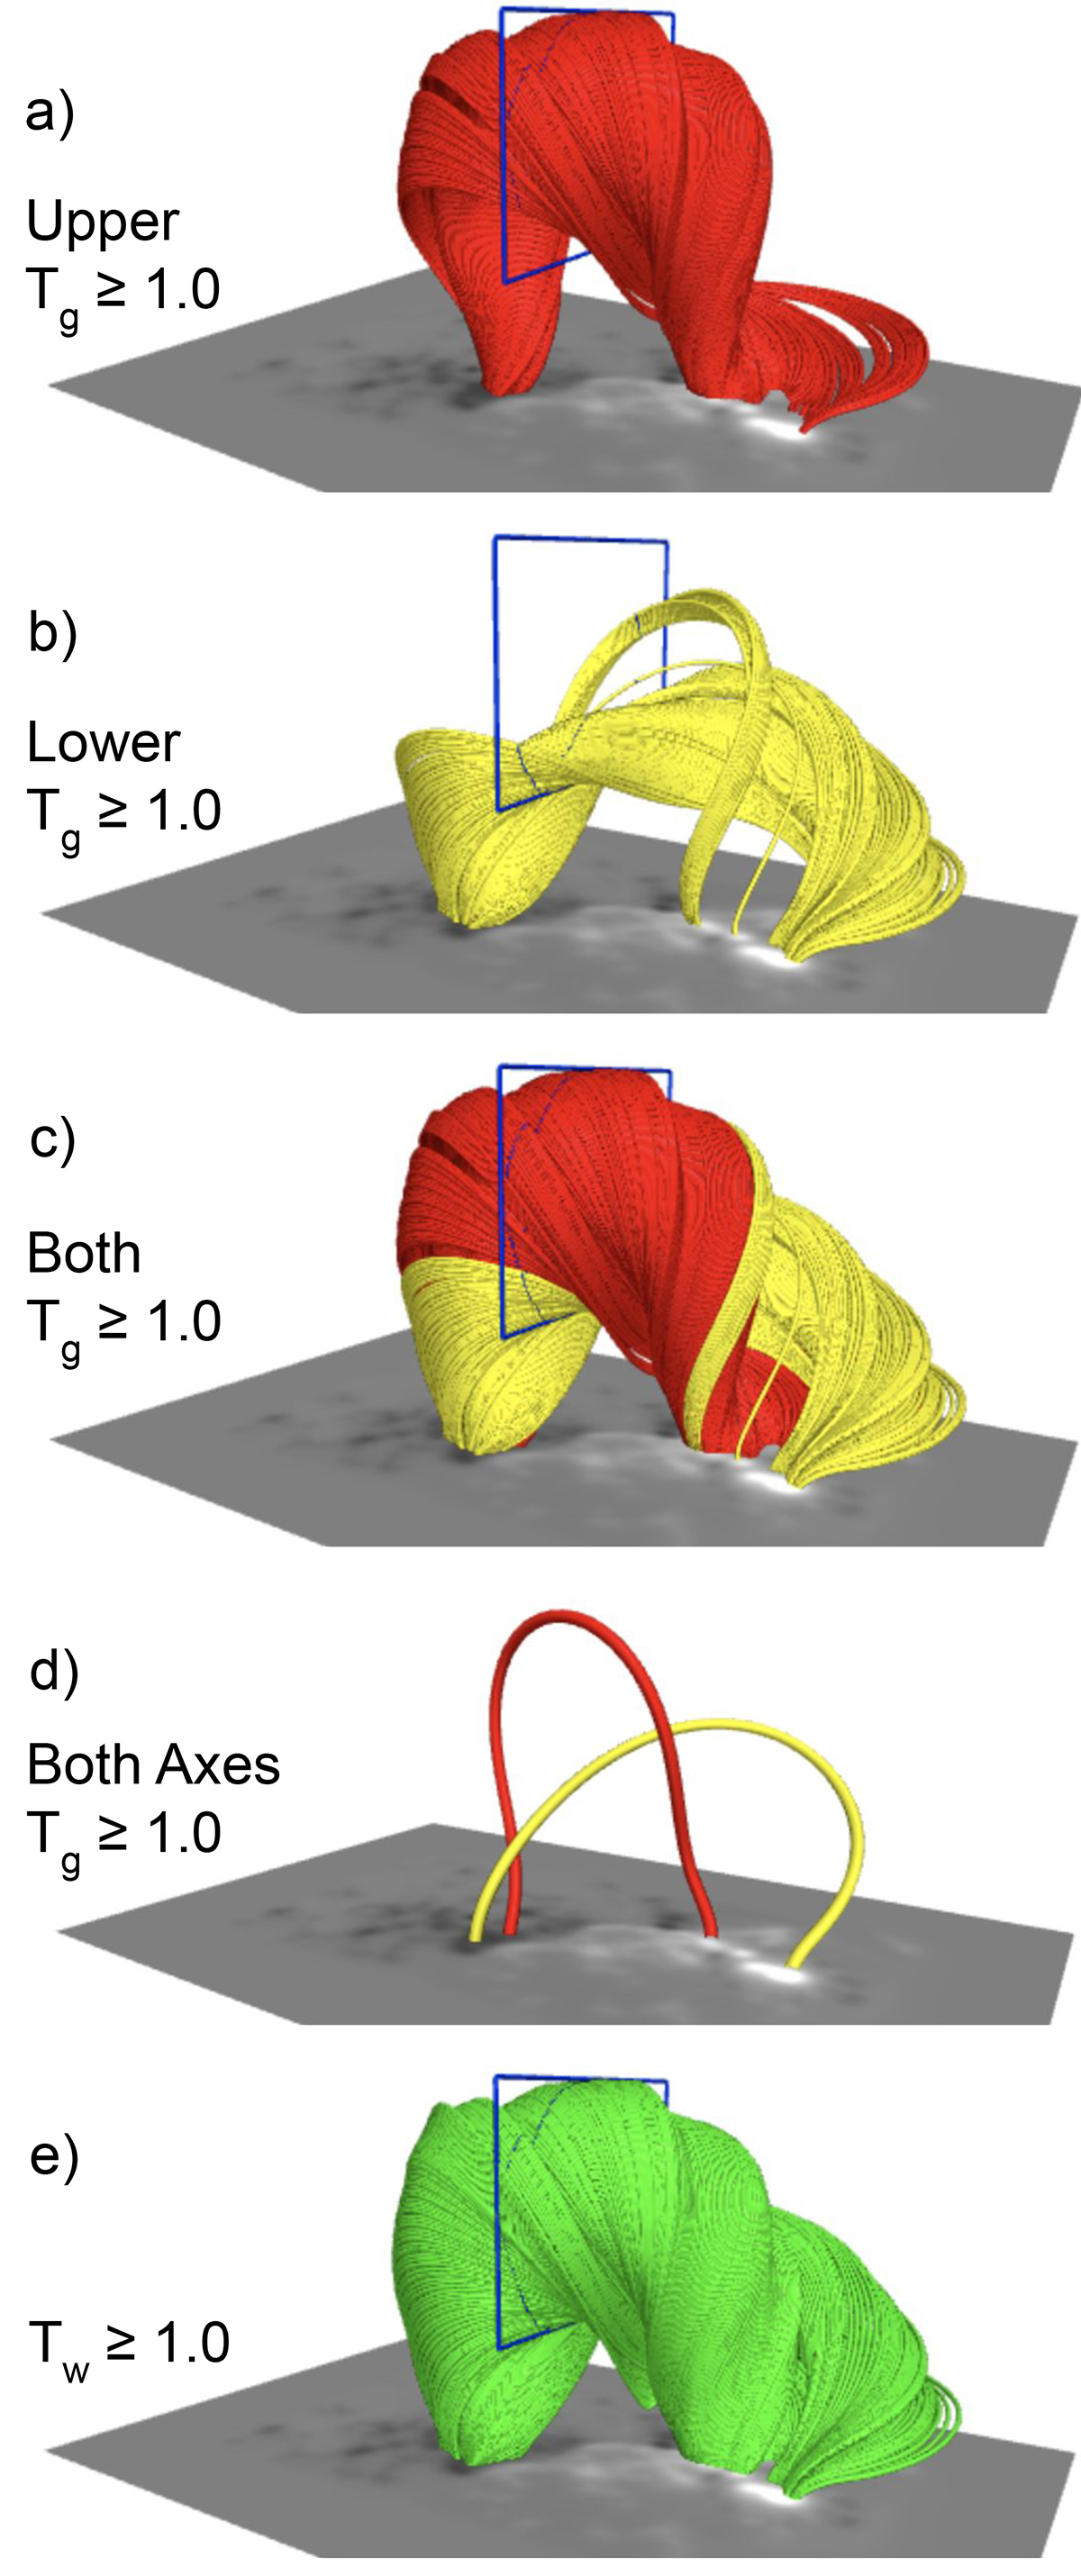
Download original image
Field lines corresponding to the contour boundaries of Fig. 3. The field of view of Fig. 3 and the aforementioned contours are overplotted in blue. Additionally, we show lines corresponding to the Tg = 1.0 contour for the upper axis (a), the Tg = 1.0 contour for the lower axis (b), for the previous two cases combined (c), for the axes of the previous two cases combined (d), and for the Tw = 1.0 contour (e). All panels include a plane of Bz from the lower boundary of the simulation domain.
Current usage metrics show cumulative count of Article Views (full-text article views including HTML views, PDF and ePub downloads, according to the available data) and Abstracts Views on Vision4Press platform.
Data correspond to usage on the plateform after 2015. The current usage metrics is available 48-96 hours after online publication and is updated daily on week days.
Initial download of the metrics may take a while.