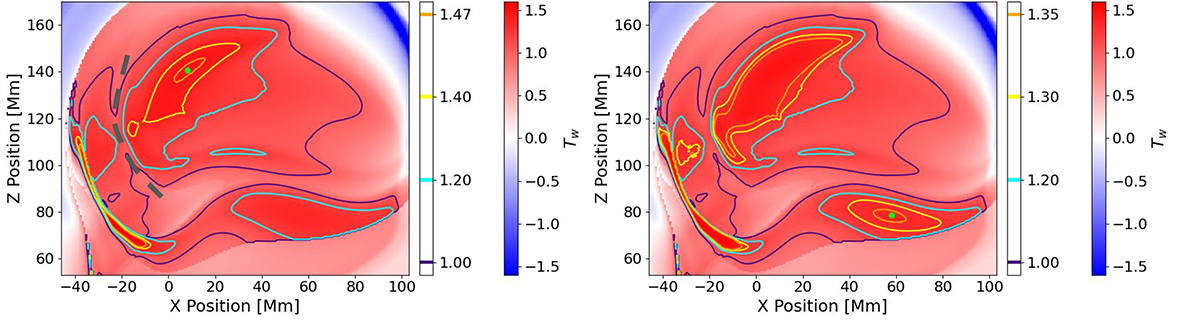
Fig. 1.
Download original image
Vertical cross-sections, which correspond to the blue boxes in Fig. 2, of the Tw twist metric map at x = 0 Mm, showing a complex but connected structure that likely consists of two separate FRs. The lime green dots indicate the location of the axes for the upper (left) and lower (right) FRs. The Tw contours have slightly different thresholds in the left and right panels to highlight the two Tw maxima. The dashed green curve separates the almost self-contained Tw ≥ 1.0 region used by Price et al. (2020) on the right from the rest of the structure as described in Sect. 3.1.
Current usage metrics show cumulative count of Article Views (full-text article views including HTML views, PDF and ePub downloads, according to the available data) and Abstracts Views on Vision4Press platform.
Data correspond to usage on the plateform after 2015. The current usage metrics is available 48-96 hours after online publication and is updated daily on week days.
Initial download of the metrics may take a while.