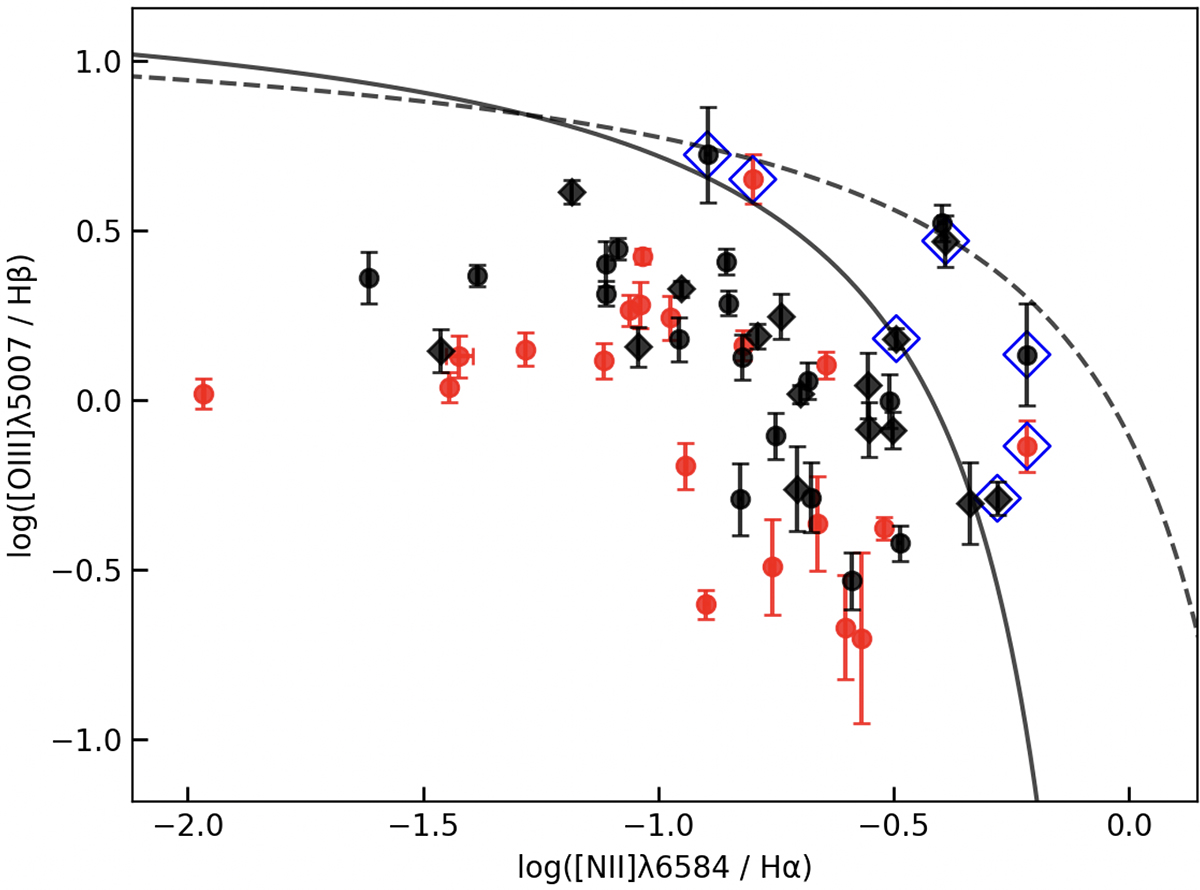
Fig. 8.
Download original image
Baldwin-Philips-Terlevich diagram of the sample. The dashed black line is the KL at z = 0 (Kewley et al. 2001), which excludes pure AGNs. The solid black line is the Kauffmann et al. (2003) limit, which excludes composite galaxies (ionization from star formation and AGNs). The red points are galaxies at the cluster redshift. Black diamonds correspond to foreground and background galaxies. According to both demarcation limits, all ELGs are SF galaxies. Data points with blue open diamonds are galaxies classified as composite galaxies, with two of them being composite galaxies at the cluster redshift and five of them found outside the cluster redshift.
Current usage metrics show cumulative count of Article Views (full-text article views including HTML views, PDF and ePub downloads, according to the available data) and Abstracts Views on Vision4Press platform.
Data correspond to usage on the plateform after 2015. The current usage metrics is available 48-96 hours after online publication and is updated daily on week days.
Initial download of the metrics may take a while.