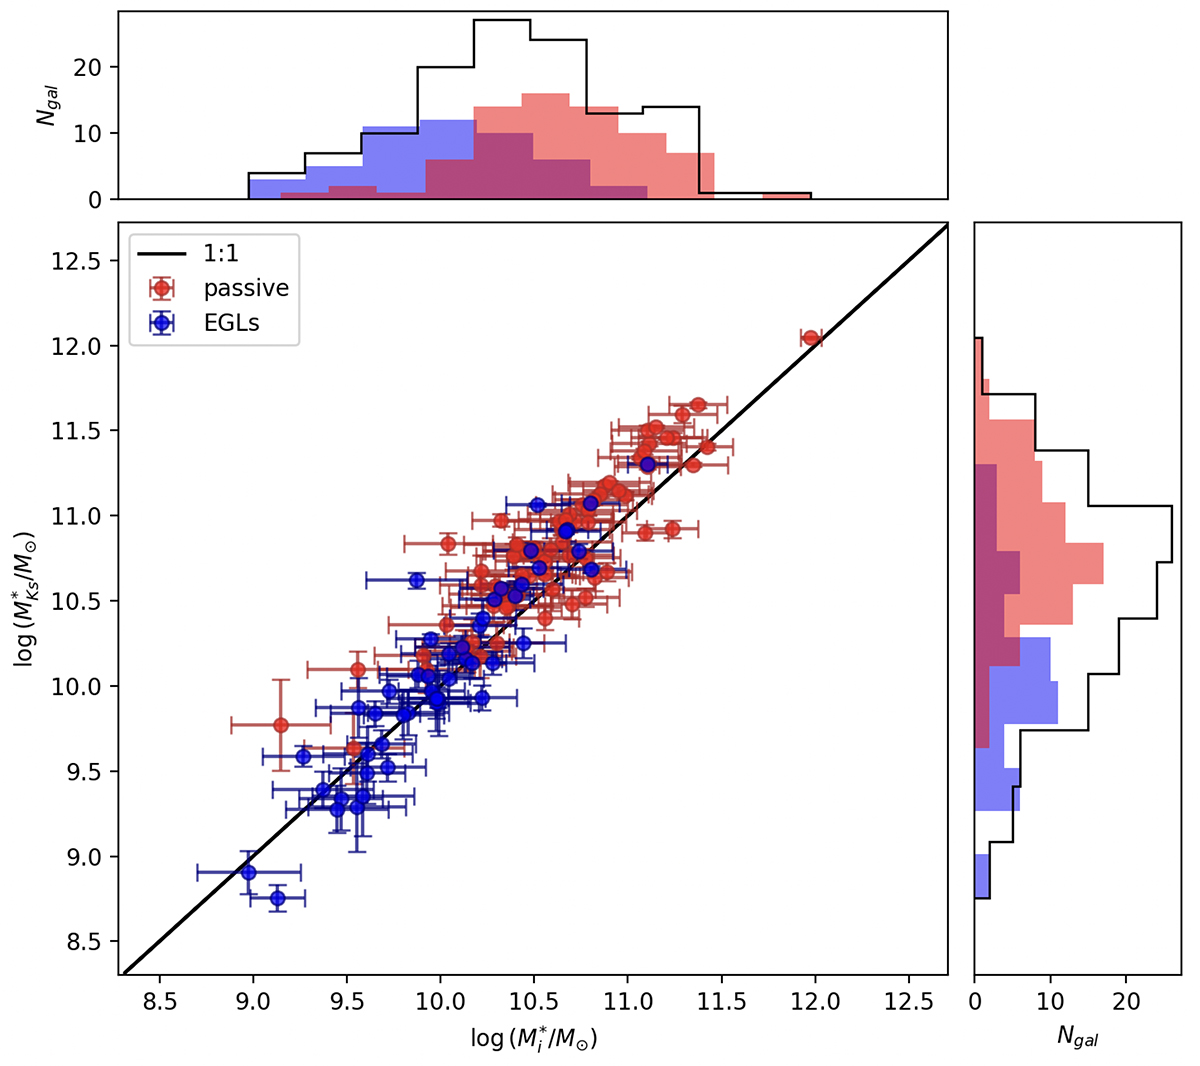
Fig. 7.
Download original image
Central panel: comparison between i and Ks-based masses. Blue and red dots represent ELGs and passive galaxies, respectively. The gray line corresponds to the 1:1 line ratio. Upper panel: distribution of optical luminosity based stellar masses. The black line shows the mass distribution of the complete sample, whereas the blue and red areas indicate the distribution of ELGs and passive galaxies, respectively. Right panel: distribution of near-infrared luminosity based stellar masses.
Current usage metrics show cumulative count of Article Views (full-text article views including HTML views, PDF and ePub downloads, according to the available data) and Abstracts Views on Vision4Press platform.
Data correspond to usage on the plateform after 2015. The current usage metrics is available 48-96 hours after online publication and is updated daily on week days.
Initial download of the metrics may take a while.