Fig. 3.
Download original image
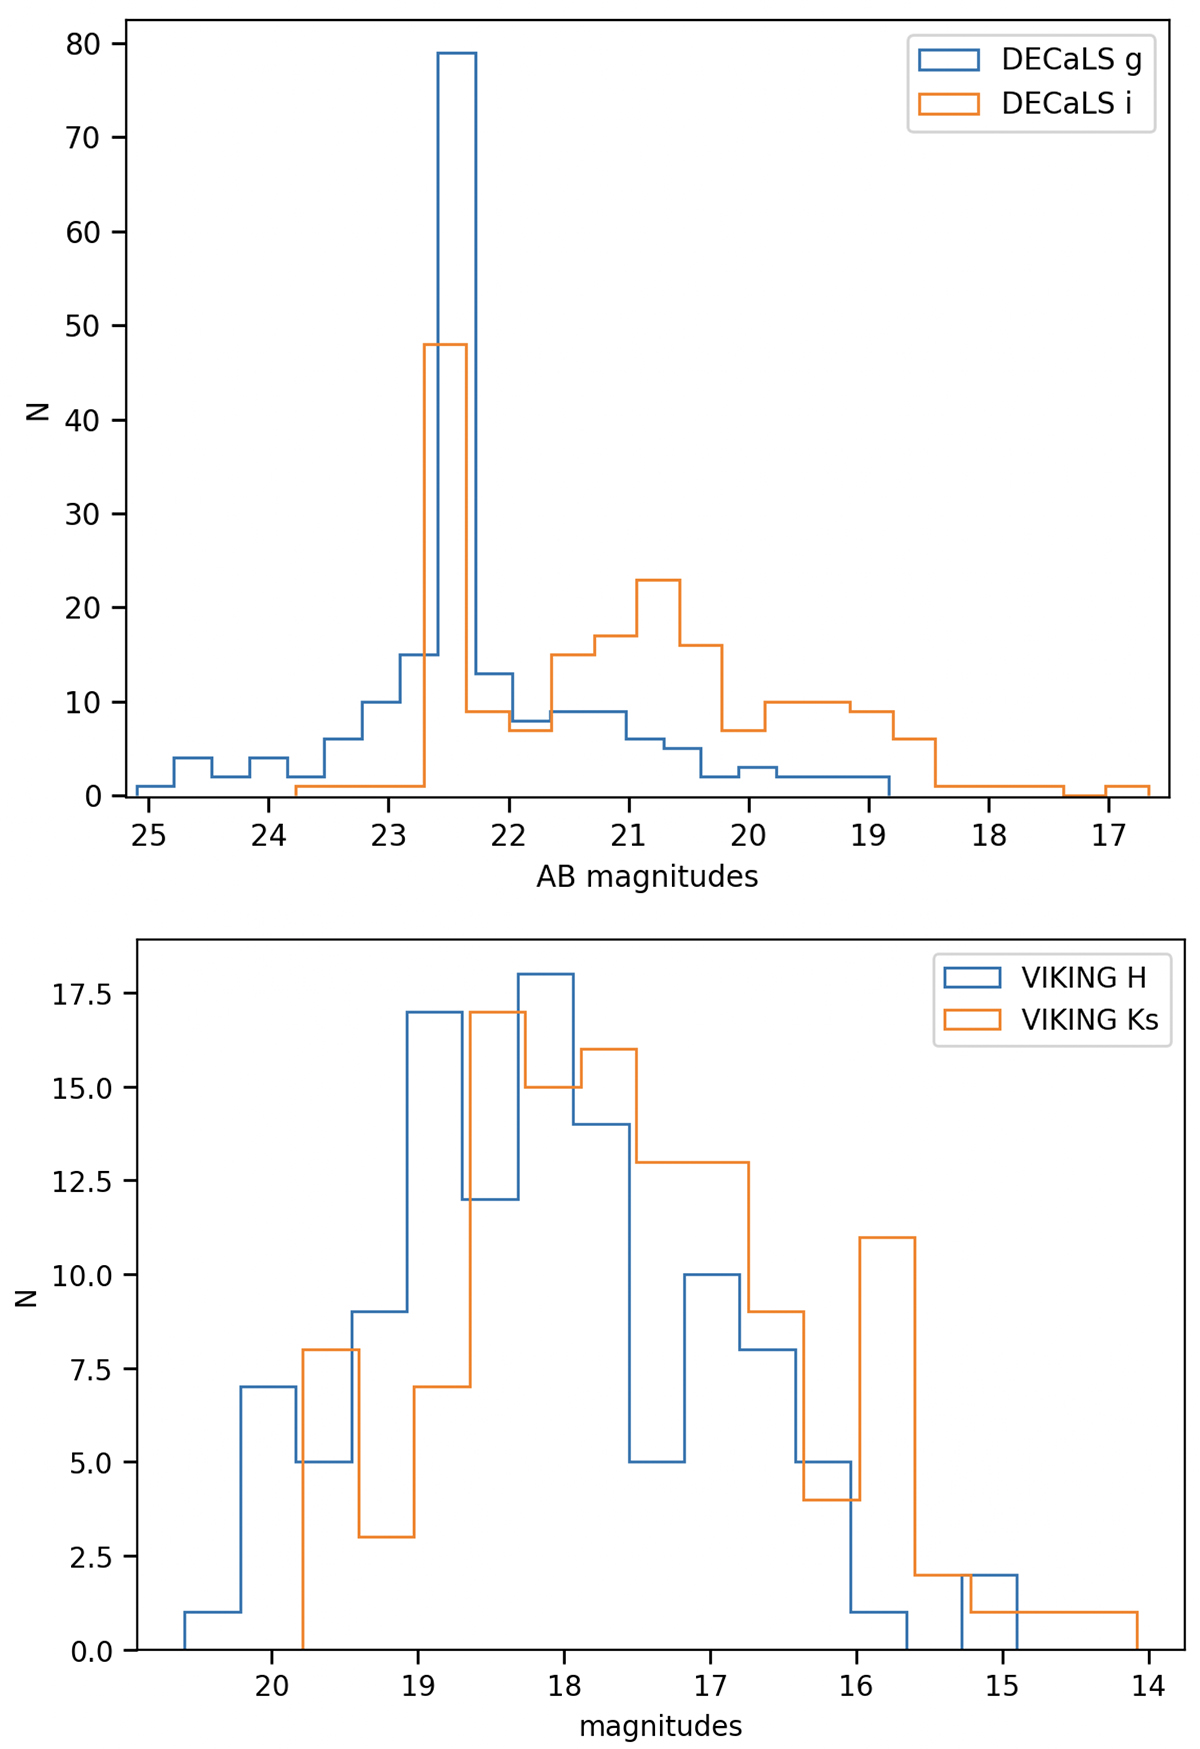
Top panel: distribution of photometric data collected from DECaLS DR10 survey. The blue line indicates the distribution of g-band magnitudes and the orange line indicates the distribution of i-band magnitudes. Bottom panel: distribution of photometric data collected by the VIKING DR4 survey. The blue line indicates the distribution of H-band magnitudes and the orange line indicates the distribution of Ks-band magnitudes.
Current usage metrics show cumulative count of Article Views (full-text article views including HTML views, PDF and ePub downloads, according to the available data) and Abstracts Views on Vision4Press platform.
Data correspond to usage on the plateform after 2015. The current usage metrics is available 48-96 hours after online publication and is updated daily on week days.
Initial download of the metrics may take a while.