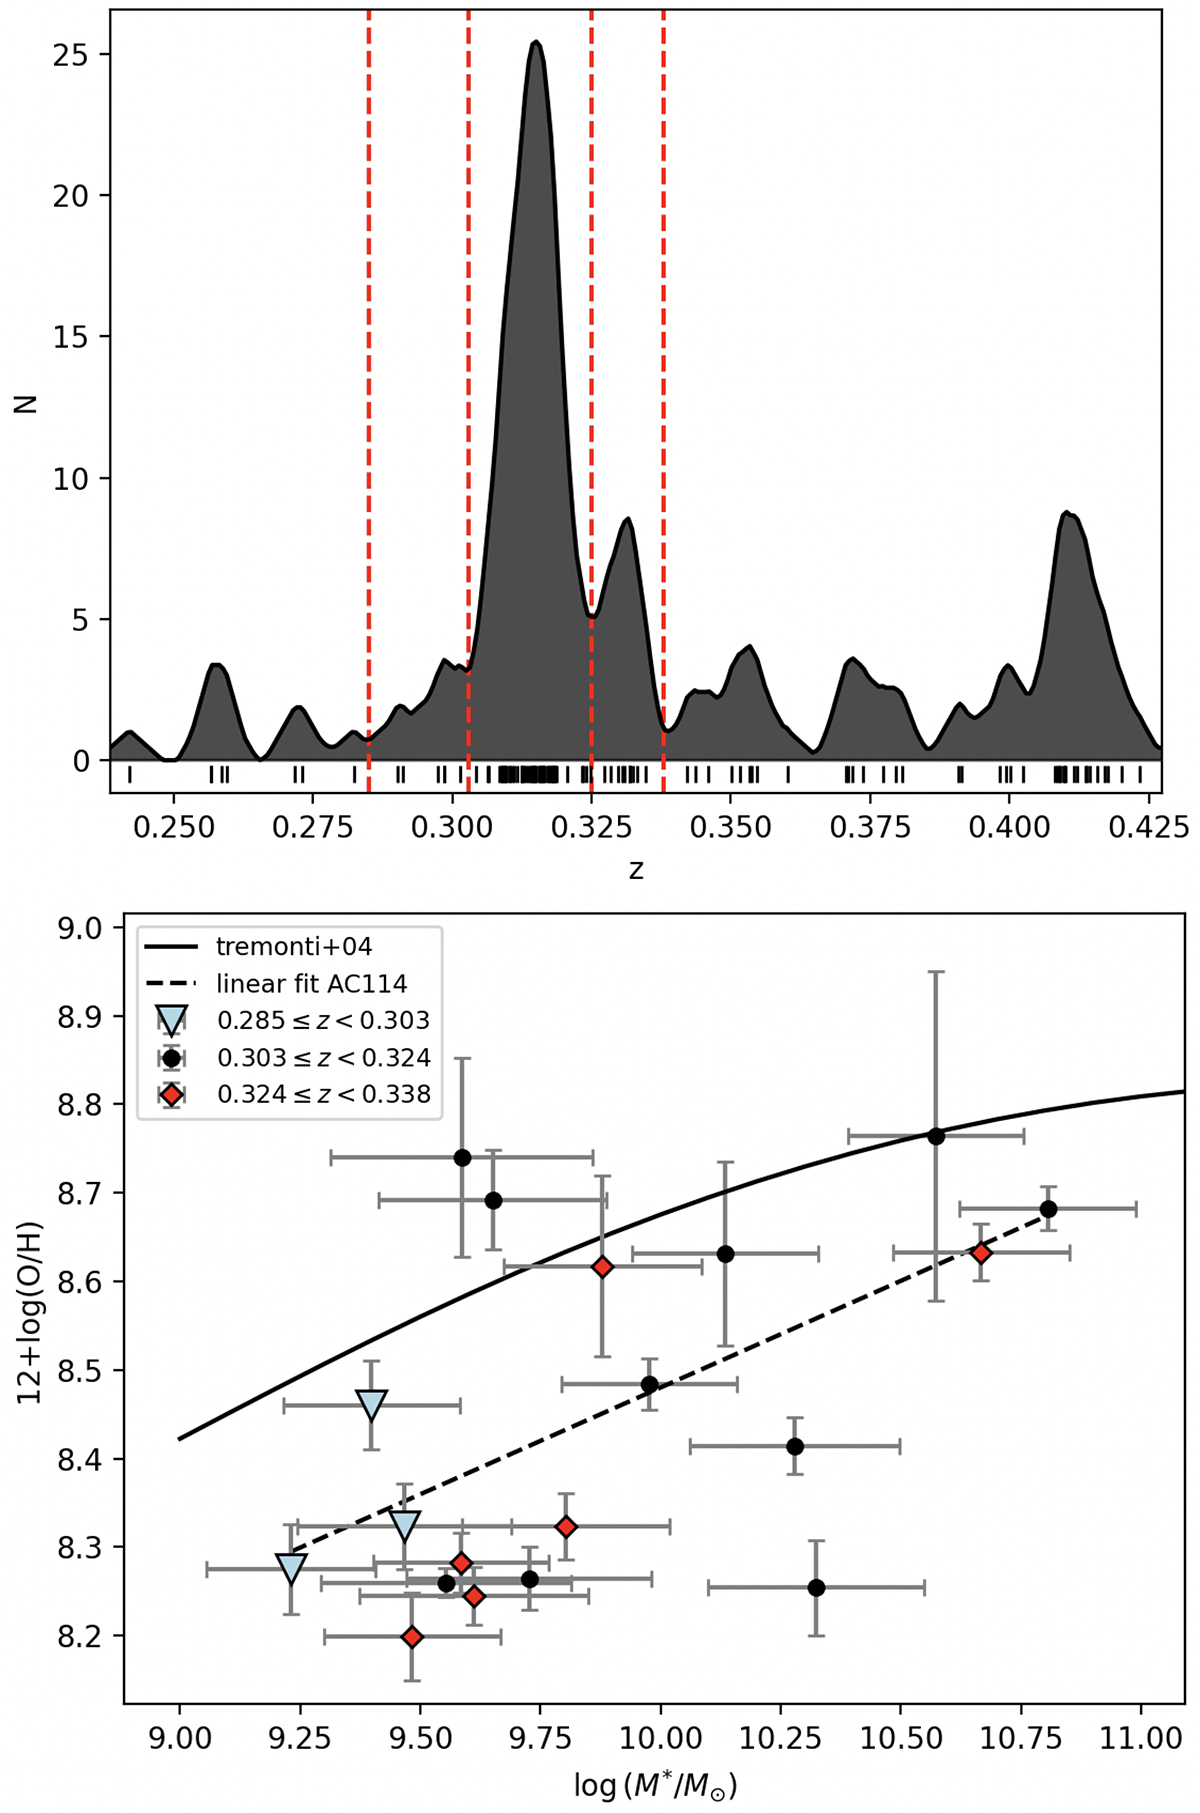
Fig. 13.
Download original image
Top panel: kernel density estimator in the redshift distribution of the galaxy cluster region: 0.28 ≤ z ≤ 0.34. Red lines show the redshift cuts of the three substructures identified: SS1 in 0.2850 ≤ z < 0.3029, SS2 with 0.3029 ≤ z < 0.3243, and SS3 covering 0.3243 ≤ z < 0.3380. Vertical black segments are the clustercentric radial distance of the galaxies. Bottom panel: galaxies of the three substructures in the mass-metallicity plane. Sky-blue triangles, black dots, and red dots represent SS1, SS2, and SS3, respectively. The black line is the cMZR.
Current usage metrics show cumulative count of Article Views (full-text article views including HTML views, PDF and ePub downloads, according to the available data) and Abstracts Views on Vision4Press platform.
Data correspond to usage on the plateform after 2015. The current usage metrics is available 48-96 hours after online publication and is updated daily on week days.
Initial download of the metrics may take a while.