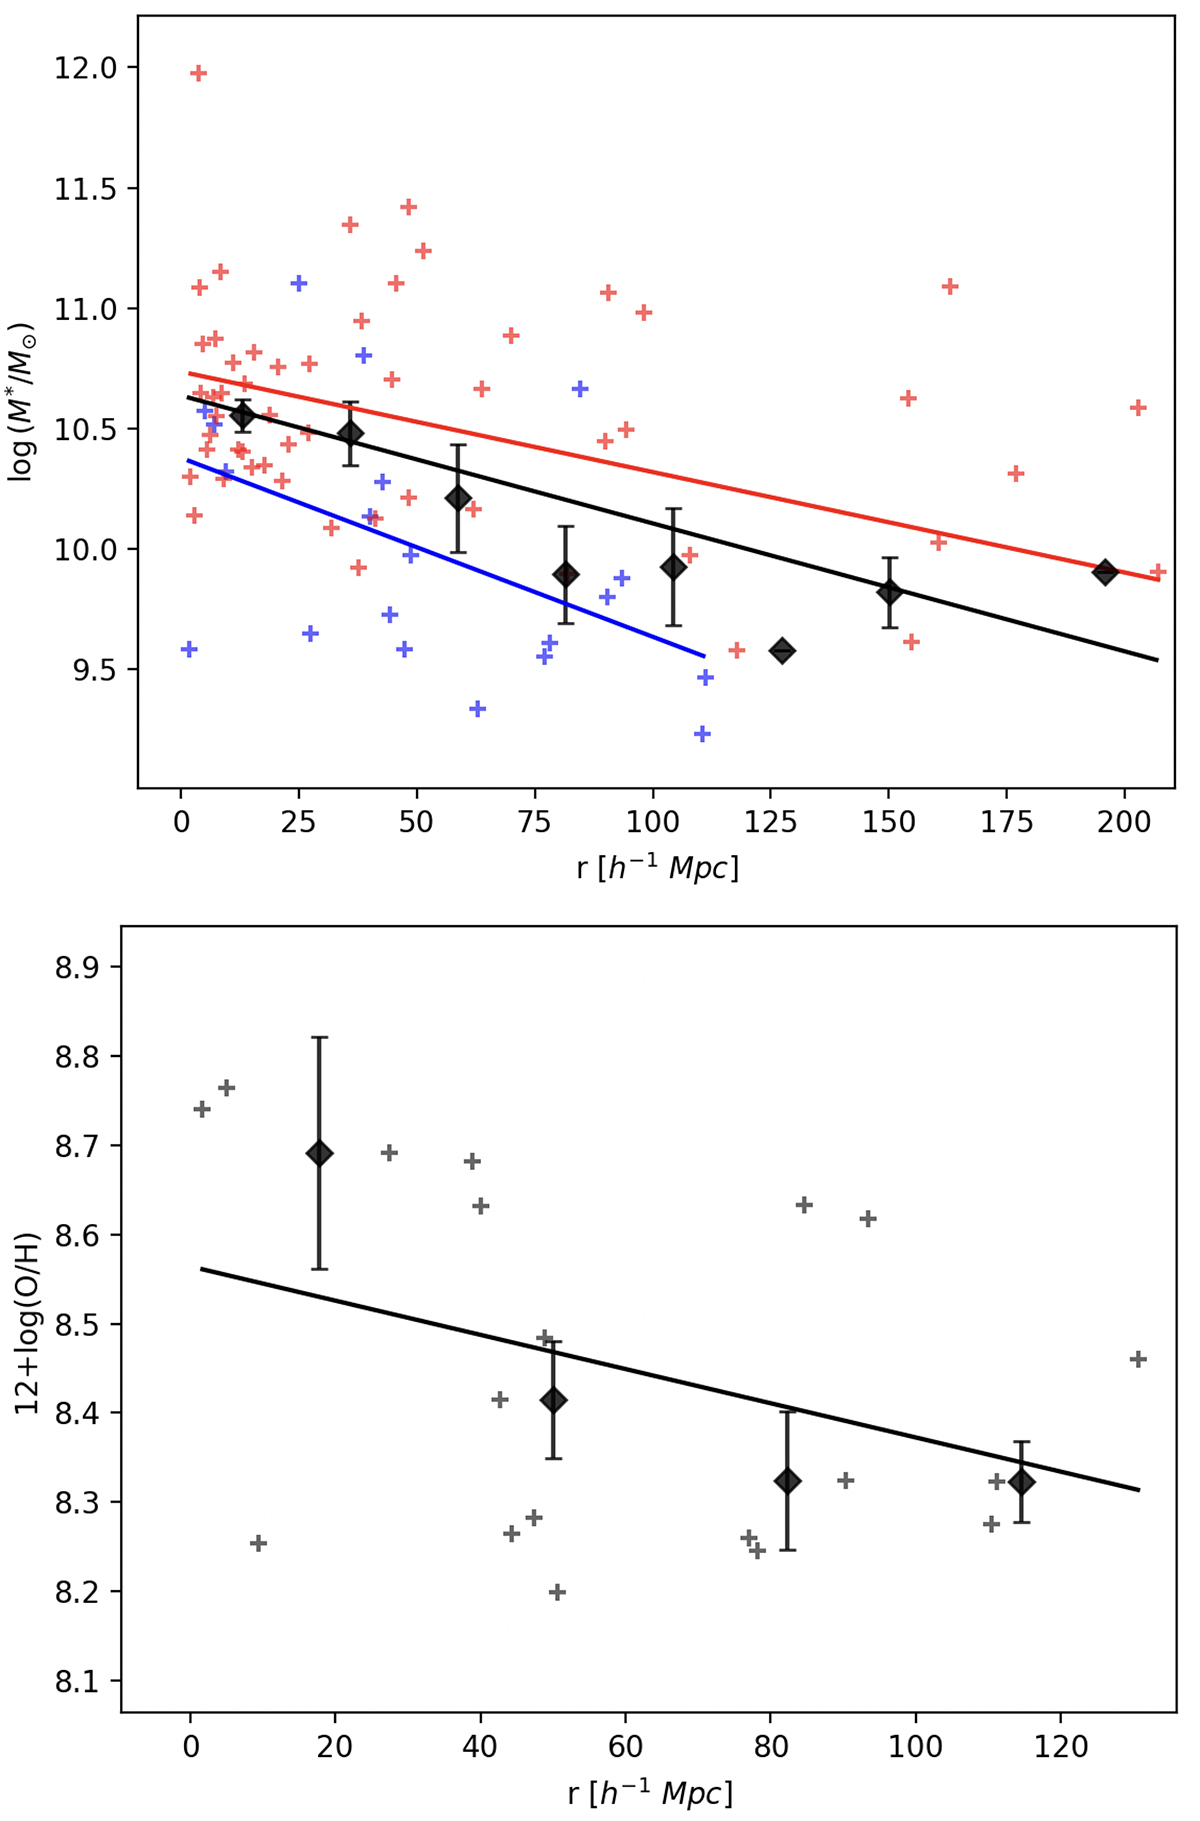
Fig. 12.
Download original image
Radial profiles of AC114. Top panel: stellar masses of galaxies as a function of the clustercentric radius. Blue and red crosses are SF and passive galaxies. Black diamonds represent mean mass bins of ∼23 h−1 Mpc. Black, blue, and red lines are the linear fits that show a negative mass-gradient as a function of the clustercentric radius for the complete sample, SF, and passive galaxies, respectively. Bottom panel: metallicity profile of the SF galaxies with available mean metallicity estimations. Black diamonds are mean metallicities in bins of ∼33 h−1 Mpc, and the black line is the linear fit that shows a weak negative gradient.
Current usage metrics show cumulative count of Article Views (full-text article views including HTML views, PDF and ePub downloads, according to the available data) and Abstracts Views on Vision4Press platform.
Data correspond to usage on the plateform after 2015. The current usage metrics is available 48-96 hours after online publication and is updated daily on week days.
Initial download of the metrics may take a while.