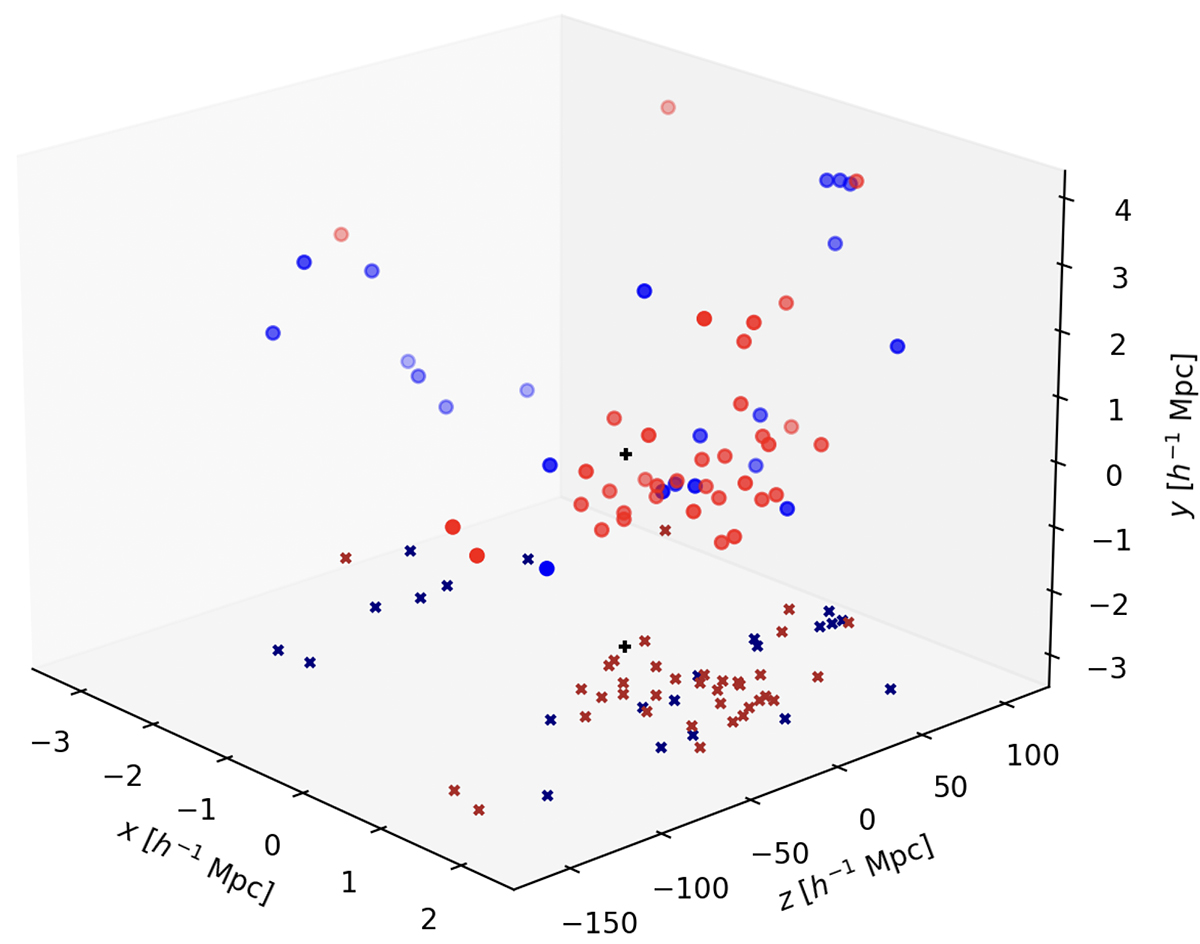
Fig. 11.
Download original image
Three-dimensional projection of the AC114 members, expressed in Mpc with respect to the cluster center. The x, y, and z axes correspond to the RA,Dec coordinates and to the redshift, respectively. Blue and red points are SF and passive galaxies, respectively. Colored crosses are the projected distribution of the cluster sample in the xz plane. The black cross indicates the center of the galaxy cluster.
Current usage metrics show cumulative count of Article Views (full-text article views including HTML views, PDF and ePub downloads, according to the available data) and Abstracts Views on Vision4Press platform.
Data correspond to usage on the plateform after 2015. The current usage metrics is available 48-96 hours after online publication and is updated daily on week days.
Initial download of the metrics may take a while.