Fig. 5
Download original image
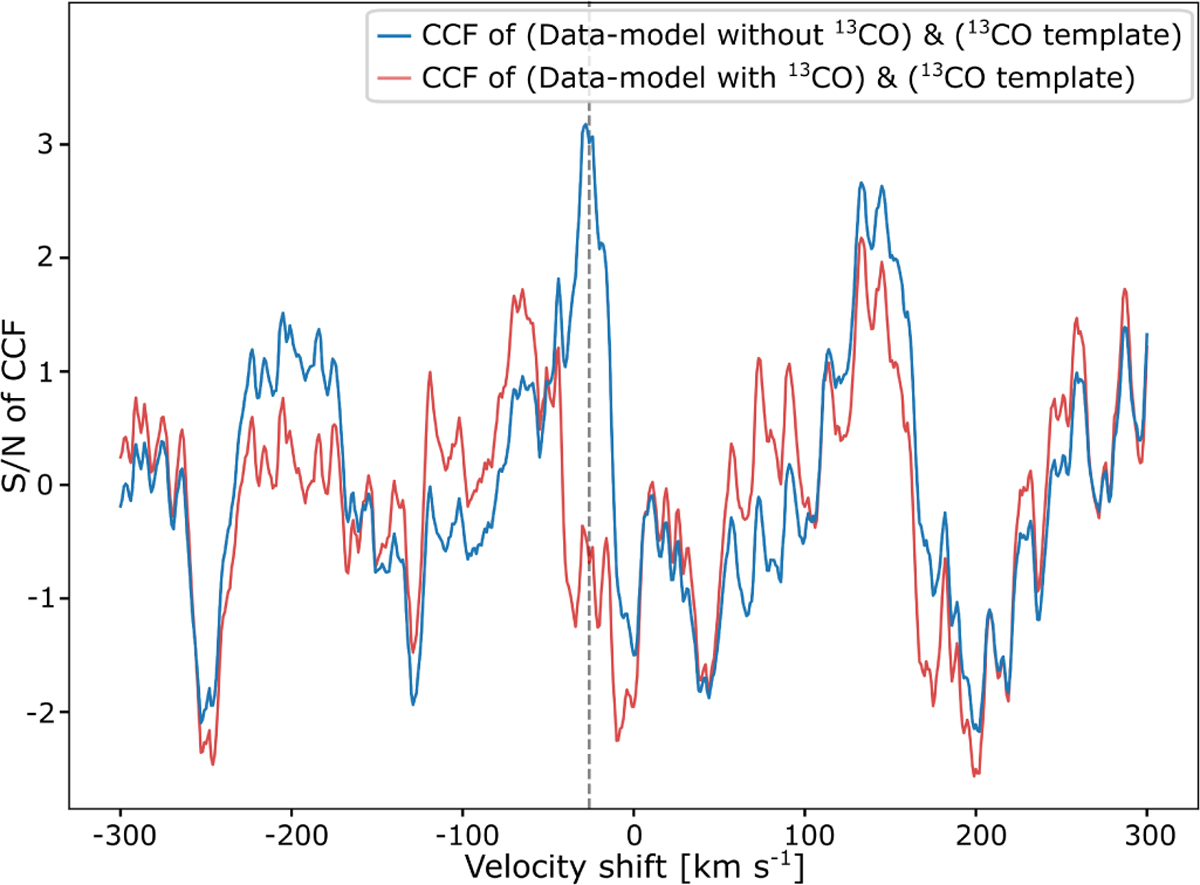
CCFs between residuals of our best-fit full model and a 13CO template. The CCF shown in blue corresponds to the residuals between our KPIC data and our full model without taking 13CO into account. Conversely, the CCF in red corresponds to the residuals between our KPIC data and our full model while taking 13CO into account. The peak in the blue CCF (that is absent in the red CCF) at the exact RV shift measured for HD 984 B shown with a vertical gray line, confirms the presence of 13CO in our data.
Current usage metrics show cumulative count of Article Views (full-text article views including HTML views, PDF and ePub downloads, according to the available data) and Abstracts Views on Vision4Press platform.
Data correspond to usage on the plateform after 2015. The current usage metrics is available 48-96 hours after online publication and is updated daily on week days.
Initial download of the metrics may take a while.