Fig. 4
Download original image
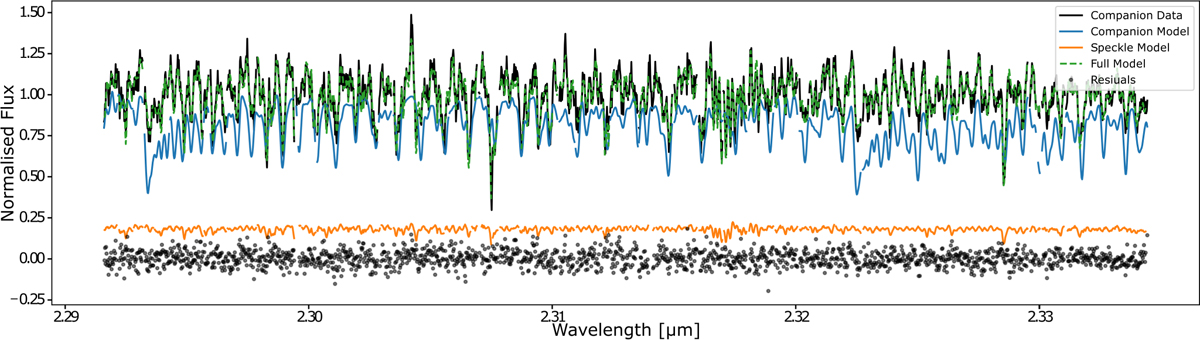
Retrieval results normalized for HD 984 B. The KPIC data are plotted in black. The companion model retrieved using nested sampling and petitRADTRANS is plotted in blue, scaled using the retrieved αp from our fit. The companion model does not include tellurics (i.e., we show the model before it was multiplied to the telluric response function) to focus on the molecular features, but tellurics are included in our fits. The stellar model used to model the speckle contribution is plotted in orange, scaled using the retrieved αs from our fit. The full model (i.e., combination of the companion and speckle model) is shown in dashed green. The residuals between the KPIC data and our retrieved model are shown as the gray points to the bottom. The x-axis is restricted for clarity, and we focus on one order only instead of the full data range (between 2.29 and 2.49 μm).
Current usage metrics show cumulative count of Article Views (full-text article views including HTML views, PDF and ePub downloads, according to the available data) and Abstracts Views on Vision4Press platform.
Data correspond to usage on the plateform after 2015. The current usage metrics is available 48-96 hours after online publication and is updated daily on week days.
Initial download of the metrics may take a while.