Fig. 1.
Download original image
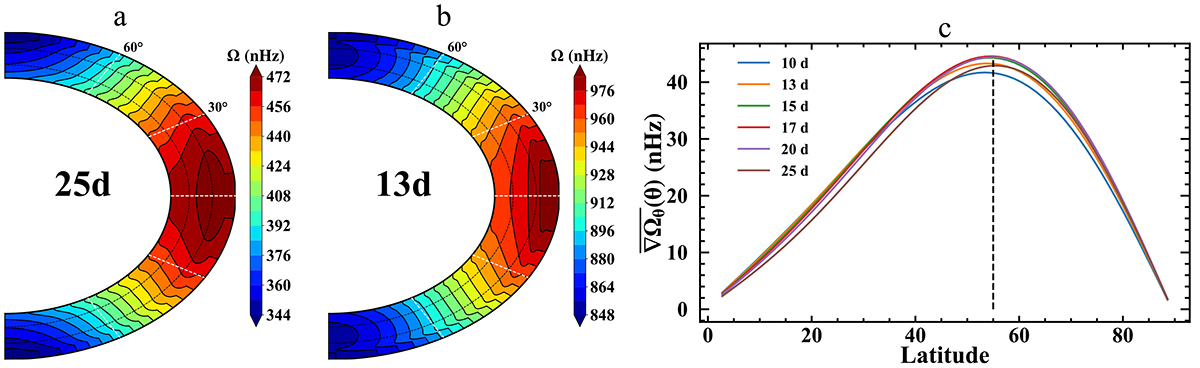
Differential rotations of solar-mass stars. Panels a and b are the profiles of differential rotation for stars with rotation periods of 25 and 13 days, respectively. Panel c shows the latitudinal distribution of the radius-averaged latitudinal shear ![]() for the different rotators studied here. The vertical dashed line denotes 55° latitude.
for the different rotators studied here. The vertical dashed line denotes 55° latitude.
Current usage metrics show cumulative count of Article Views (full-text article views including HTML views, PDF and ePub downloads, according to the available data) and Abstracts Views on Vision4Press platform.
Data correspond to usage on the plateform after 2015. The current usage metrics is available 48-96 hours after online publication and is updated daily on week days.
Initial download of the metrics may take a while.