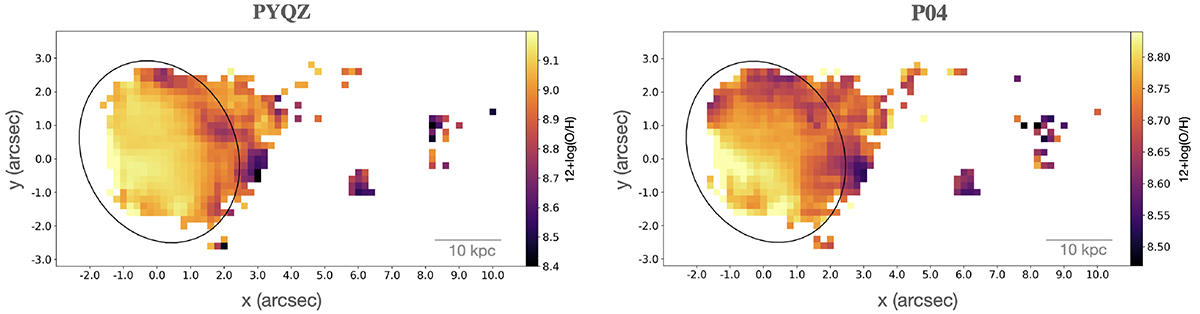
Fig. 7.
Download original image
A370-01 metallicity maps. The black ellipses identify the 5σ contour over the background, which we recognize as the disk boundary. The panels show the 12 + log(O/H) maps calculated by PYQZ (left) and P04 (right). Since the two methods employ distinct emission lines to compute the metallicity (as mentioned in Sect. 4.3), they do not necessarily share the same usable spaxels. Additionally, as explained in Sect. 4, intrinsic variations in the estimated absolute values found using the two methods render it impractical to present maps with identical metallicity ranges as a colorbar.
Current usage metrics show cumulative count of Article Views (full-text article views including HTML views, PDF and ePub downloads, according to the available data) and Abstracts Views on Vision4Press platform.
Data correspond to usage on the plateform after 2015. The current usage metrics is available 48-96 hours after online publication and is updated daily on week days.
Initial download of the metrics may take a while.