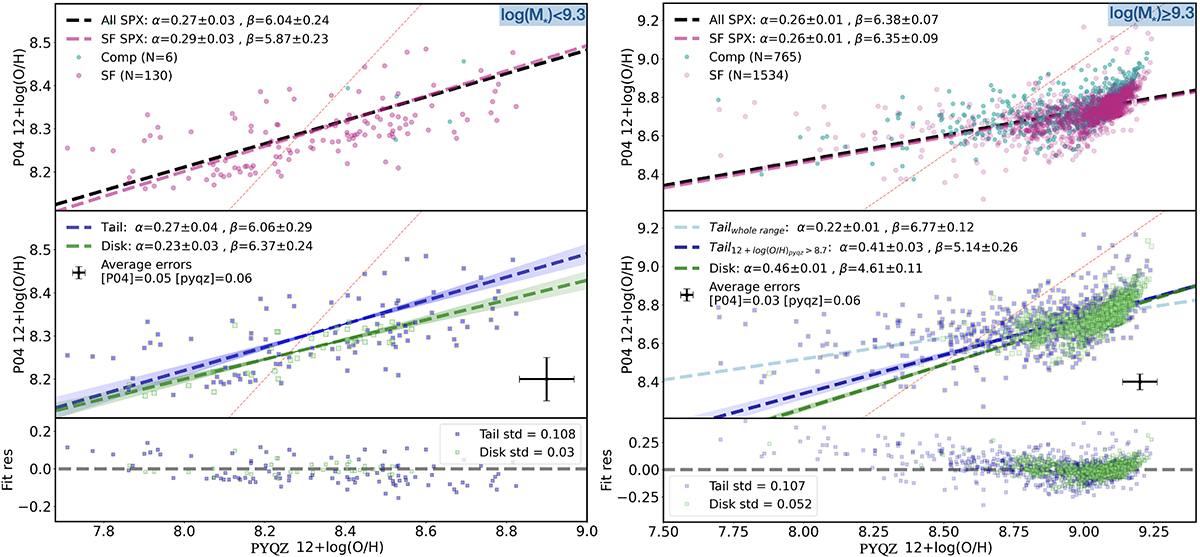
Fig. 6.
Download original image
Comparison of the metallicity measurements of all spaxels in all galaxies of our sample for the two different metallicity diagnostics. Right: high-mass galaxies (log(M⋆/M⊙)≥9.3). Left: low-mass galaxies (log(M⋆/M⊙) < 9.3). In both plots, the behavior of star-forming (SF) and composite (Comp) spaxels can be seen in the top panels. Their relationship is modeled via a linear approach and a least square fit, where P0412+log(O/H) = α × PYQZ12+log(O/H) + β. The dotted red line represents the one-to-one relation, while the dashed black and pink lines are the SF+Comp (all spaxels) and SF linear fits, respectively. Middle panels: disk (green) and tail (blue) spaxels are linearly modeled separately. The error bars are the metallicity uncertainties described in Sect. 4. Bottom panels: residuals from the overall fit (black line in top panel), with standard deviation (std) values shown.
Current usage metrics show cumulative count of Article Views (full-text article views including HTML views, PDF and ePub downloads, according to the available data) and Abstracts Views on Vision4Press platform.
Data correspond to usage on the plateform after 2015. The current usage metrics is available 48-96 hours after online publication and is updated daily on week days.
Initial download of the metrics may take a while.