Fig. 10.
Download original image
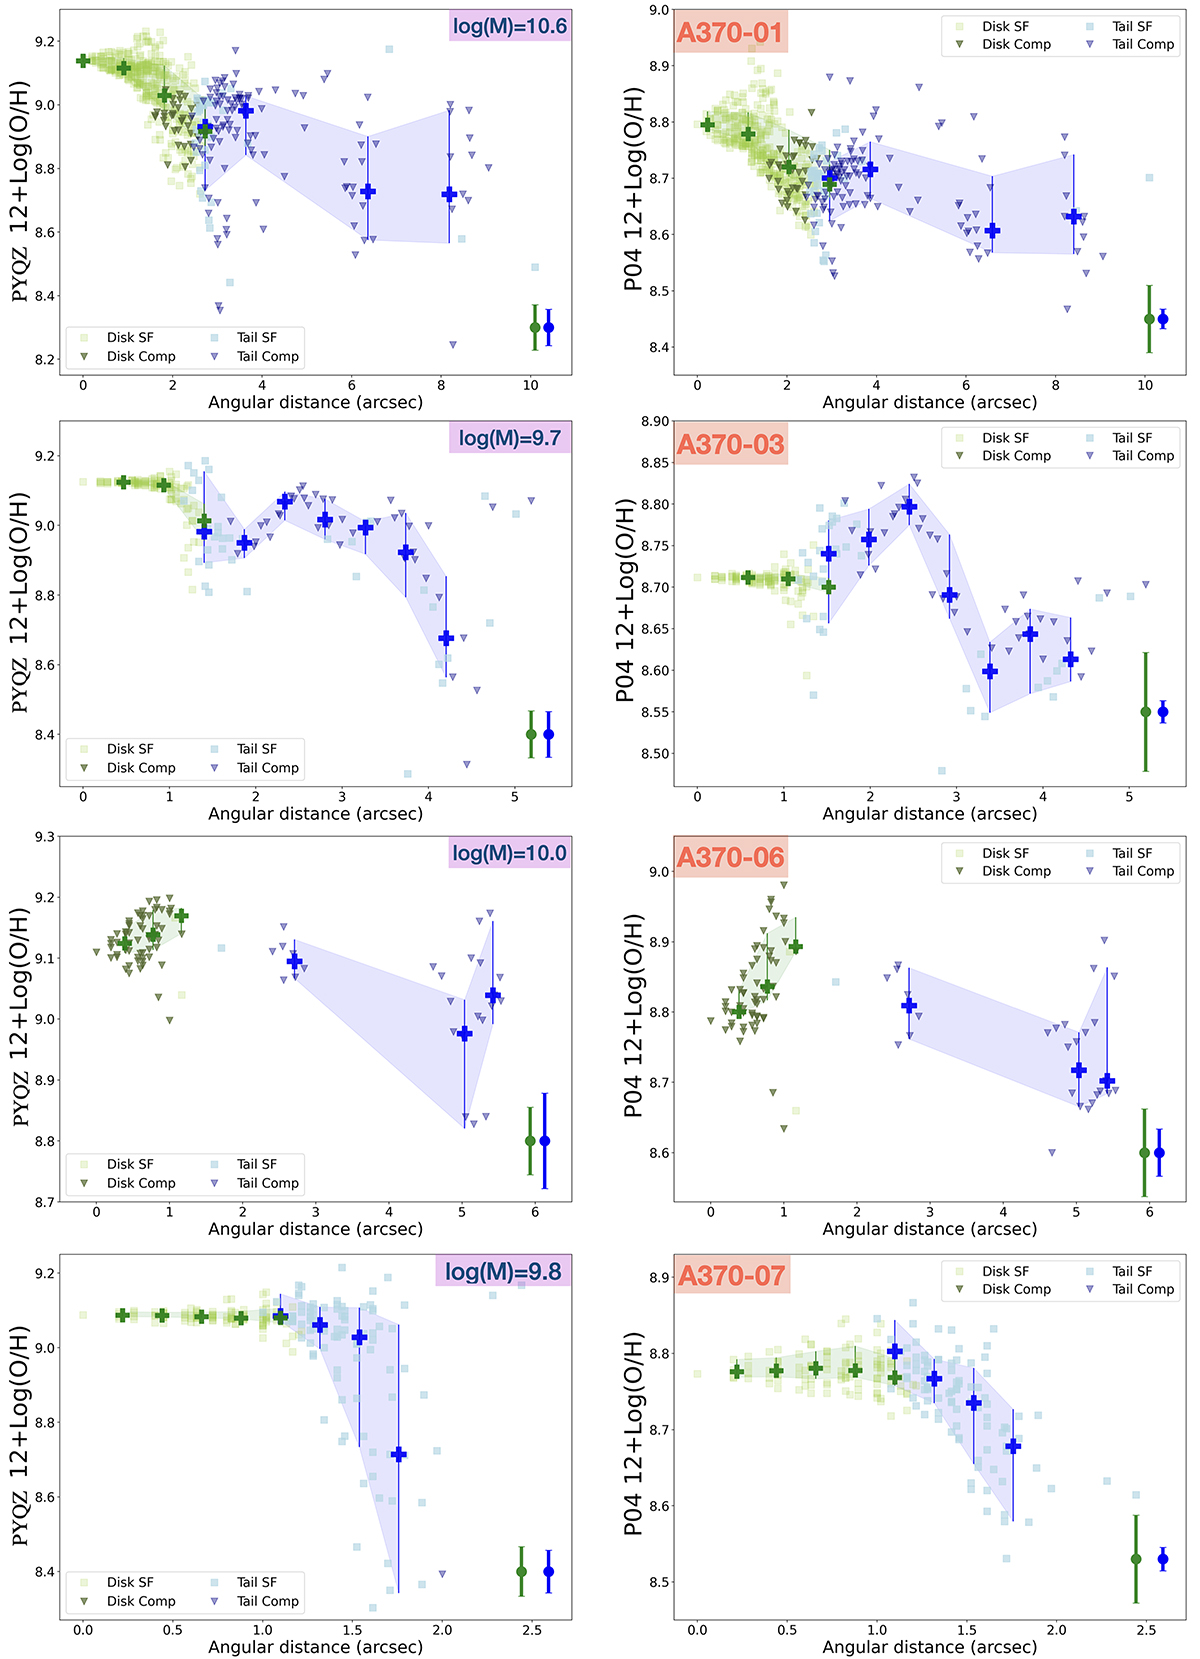
Metallicity gradients computed using two different methods: PYQZ (left panel) and P04 (right panel). Disk and tail spaxels are color-coded in green and blue, respectively. Triangles represent composite spaxels (Comp) and squares star-forming spaxels (SF). The bold plus markers are median 12 + log(O/H) values in each angular distance bin, and the associated error bars (and shades) represent the 1σ percentile. Also, the stellar mass of galaxies (M) is given in the left panels in solar mass units (continued in Fig. A.1).
Current usage metrics show cumulative count of Article Views (full-text article views including HTML views, PDF and ePub downloads, according to the available data) and Abstracts Views on Vision4Press platform.
Data correspond to usage on the plateform after 2015. The current usage metrics is available 48-96 hours after online publication and is updated daily on week days.
Initial download of the metrics may take a while.