Fig. B.1.
Download original image
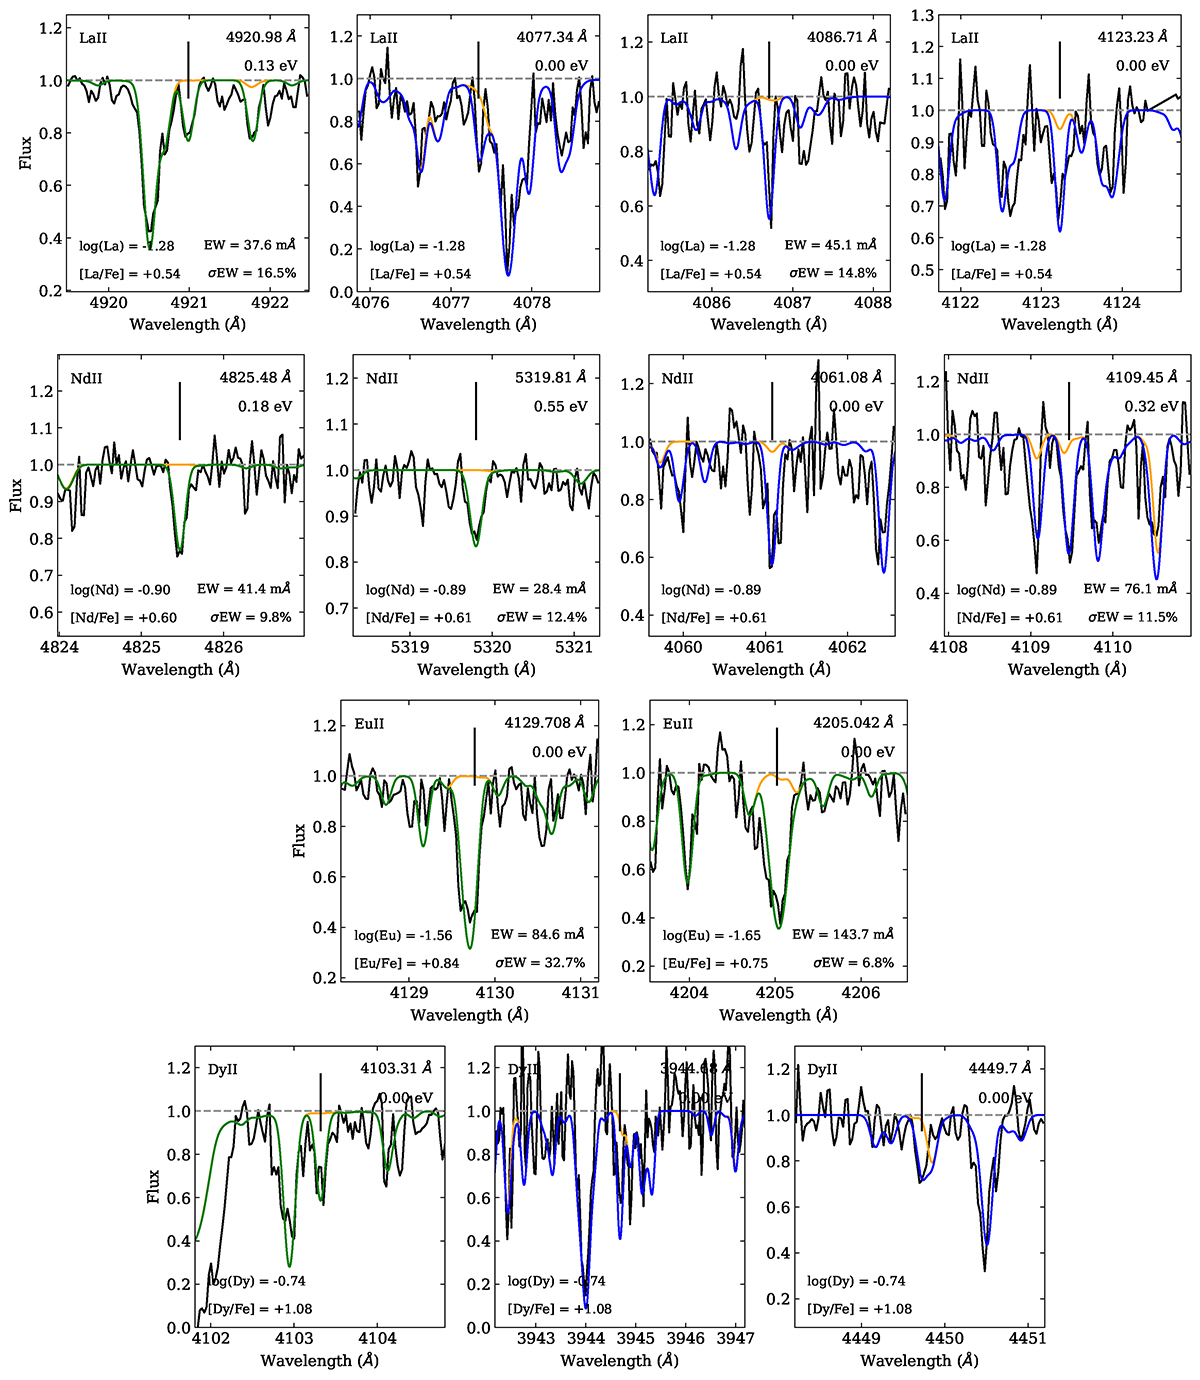
Individual lines of heavy (Z> 56) neutron-capture elements measured in the r-process rich star, fnx_06_019. From top to bottom: La II, Nd II, Eu II, and Dy II. The best fit synthetic spectra used for abundance determination are shown in green, while the synthetic spectra computed only to check agreement with other detected lines of lesser quality are in blue. The synthetic spectra computed without the element of interest, allowing the identification of blends, are in orange.
Current usage metrics show cumulative count of Article Views (full-text article views including HTML views, PDF and ePub downloads, according to the available data) and Abstracts Views on Vision4Press platform.
Data correspond to usage on the plateform after 2015. The current usage metrics is available 48-96 hours after online publication and is updated daily on week days.
Initial download of the metrics may take a while.