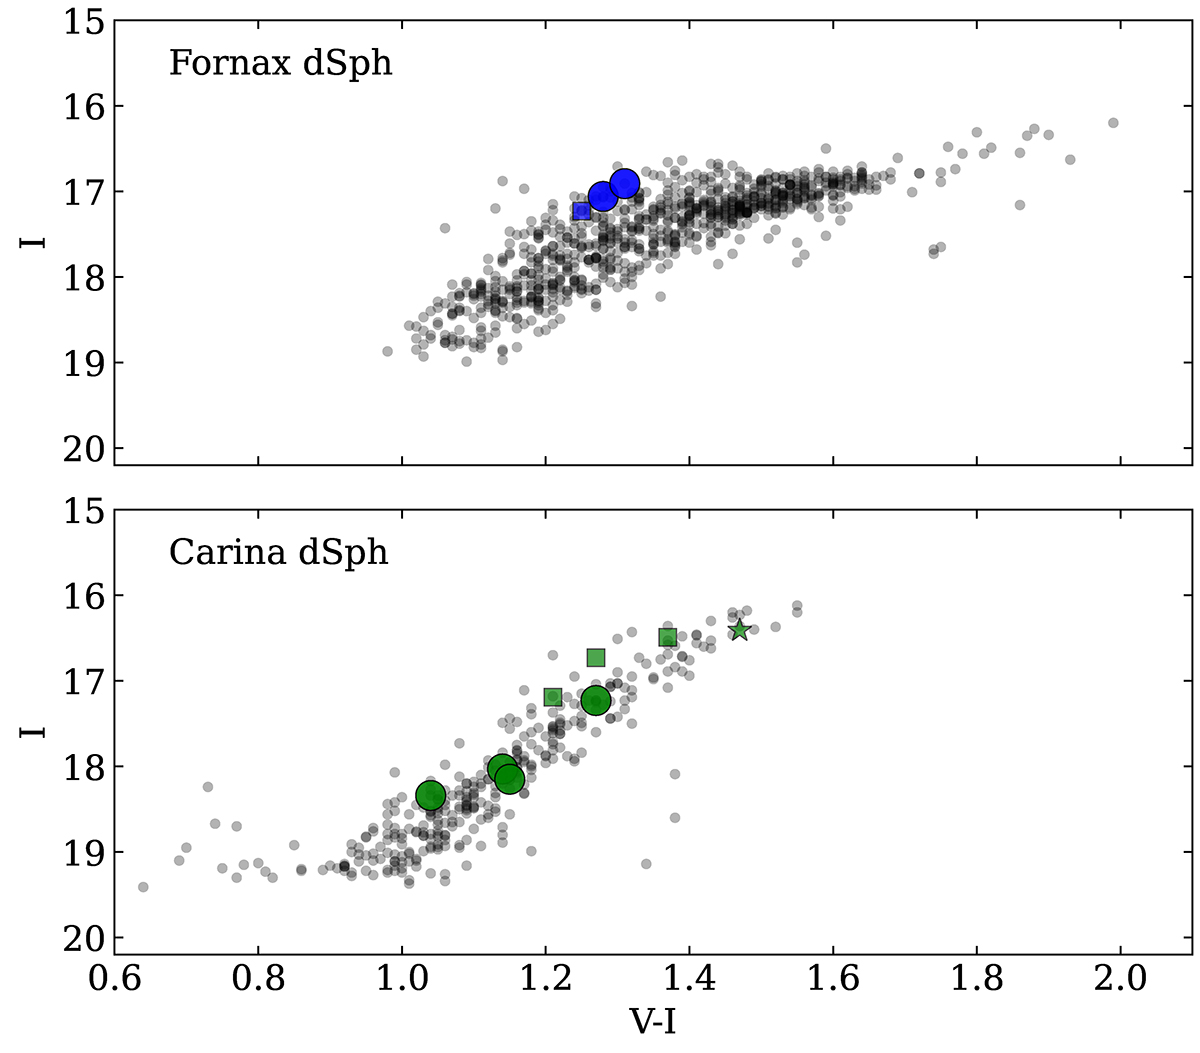
Fig. 1.
Download original image
Color–magnitude diagram (I, V − I) of the RGB of Fornax (top) and Carina (bottom). The V, I magnitudes are from ESO 2.2 m WFI (Battaglia et al. 2006; Starkenburg et al. 2010). The gray dots are probable Fornax and Carina members based on their radial velocities (Starkenburg et al. 2010). The colored points are stars with [Fe/H] ≤ –2.5 and more than five chemical abundances measured. The large blue and green circles show respectively the Fornax and Carina stars analyzed here. Data shown from other works are Tafelmeyer et al. (2010) (small blue square); Venn et al. (2012) (small green squares); and Susmitha et al. (2017) (small green star).
Current usage metrics show cumulative count of Article Views (full-text article views including HTML views, PDF and ePub downloads, according to the available data) and Abstracts Views on Vision4Press platform.
Data correspond to usage on the plateform after 2015. The current usage metrics is available 48-96 hours after online publication and is updated daily on week days.
Initial download of the metrics may take a while.